Social Welfare: Interdisciplinary Approach eISSN 2424-3876
2023, vol. 13, pp. 22–41 DOI: https://doi.org/10.15388/SW.2023.13.12
The Relationship Between Time Allocation for Work and Personal Life and Happiness
Viktorija Tauraitė
Vytautas Magnus University, Lithuania
tauraiteviktorija@gmail.com
https://orcid.org/0000-0002-7045-7570
Akvilė Aleksandravičienė
Vytautas Magnus University, Lithuania
akvile.aleksandraviciene@vdu.lt
http://orcid.org/0000-0003-4885-5602
Abstract. The aim of the article is to identify the relationship between time allocation for work and personal life and happiness by reviewing the theoretical aspects of time allocation for work and personal life and happiness and by presenting an empirical research methodology. A review of the scientific literature is carried out using a comparative analysis and a generalisation method. Empirical research was conducted using statistical data, correlation analyses, non-parametric Mann-Whitney U test, X2 criterion, and data collection methods: questionnaire and time diary. The number of respondents is 1073, the studied population is self-employed persons in Lithuania.
Empirical evidence shows that in 2019, self-employed people in Lithuania spent 77.5 percent of their daily time on their personal life (mostly to sleep and leisure) and 22.5 percent on work. With a 95 percent probability, it was found that the time spent on sleep (08:41) by 15-24-year-olds is statistically significantly different from other age groups (H11 confirmed). Although self-employed individuals were most likely to be happy, satisfied with work and satisfied with their personal life in 2019, but those aged 15-24 were the happiest. However, men were more satisfied with work and women were more satisfied with their personal life. There was a statistically significant relationship at a 95 percent confidence level between the level of work-life balance of the self-employed person and happiness (H21 confirmed).
Keywords: time allocation, happiness, job satisfaction, life satisfaction, self- employed persons.
Recieved: 15/04/2023. Accepted: 06/09/2023
Copyright © 2023 Viktorija Tauraitė, Akvilė Aleksandravičienė. Published by Vilnius University Press. This is an Open Access journal distributed under the terms of the Creative Commons Attribution 4.0 (CC BY 4.0) License, which permits unrestricted use, distribution, and reproduction in any medium, provided the original author and source are credited.
Introduction
Work-life balance is a very topical issue in the context of modern life. Scientists Mousa (2018), Mladenović and Krstić (2021), Vallasek (2021), Austen (2022), Sriram et al. (2022), Owens-Horton (2022), Abubaker et al. (2022), Bahrami et al. (2023) and others are studying time allocation and work-life balance, identifying the negative consequences of inefficient time allocation for productivity, health, personal life, etc. Work-life conflict inevitably has an impact on job satisfaction, satisfaction with personal life and, finally, on the sense of happiness. According to the theory of upward interaction, it can be argued that a person is happy only when he or she feels both job satisfaction and personal life satisfaction. By combining time allocation to work and personal life and happiness as an economic phenomenon from a theoretical and empirical point of view, it is possible to carry out a relevant study and to find out what kind of links exist between these two phenomena.
This paper focuses on the self-employed, as these individuals receive relatively less attention in the scientific literature. Moreover, this category of the employed population is extremely significant and growing one in the 21st century. For example, in 2019, almost 14 percent of the employed population in Lithuania was self-employed (excluding farmers), and in 2020 this figure reached almost 15 percent (State Data Agency, 2023). Thus, taking into account the growing potential of this category of the employed population and the unique ability of these individuals to independently control their own time, self-employed individuals are analysed in more detail in this article.
The paper examines the relationship between time allocation for work and personal life and happiness in the population of self-employed persons in Lithuania. The case of Lithuania is not chosen by chance, as not enough studies of this kind have been carried out in the case of Lithuania, or they are focused on a different target group, period, etc.
The scientific value of the paper is reflected at the methodological level, as the research methodology was designed and adapted specifically for this study and to answer the emerging scientific problem related to the relationship between time allocation for work and personal life and happiness. At the empirical level, a relevant category of the employed population is studied: self-employed persons, on the basis of which it is aimed to clarify the main links and other relevant aspects between time allocation to work and personal life and happiness.
Research problem: What is the relationship between work-life balance and happiness?
The aim of this paper is to identify the relationship between time allocation to work and personal life and happiness by reviewing the theoretical aspects of time allocation to work and personal life and happiness and by presenting the empirical research methodology.
The novelty of the article is related to the two investigated phenomena (time allocation to work and personal life and happiness) and the links between them. A more detailed analysis of the mentioned phenomena provides an opportunity to find out possible new links and their possible consequences. In addition, the novelty can be based on conducting a study of the behavioural characteristics of the self-employed population.
The theoretical aspects of time allocation to work and personal life and the economics of happiness are examined in the paper, applying a comparative analysis of the scientific literature and a generalisation approach. Empirical research is presented using statistical data, correlation analysis, non-parametric Mann-Whitney U test, X2 criterion, data collection methods: questionnaire and time diary. SPSS Statistics software is used for the analysis of empirical data.
Literature Review
Time Allocation for Work and Personal Life
In studies of labour market behaviour of labour supply participants, time is often split between work and personal time. This classification of time is used by Douglas and Morris (2006), Cho et al. (2016), Kaliannan et al. (2016), Nilsson et al. (2017), Oludayo et al. (2018) and other researchers. Taking all this into account, this paper also divides time into time spent on work and time spent on personal life. In the scientific literature, working time is often defined as time devoted to paid work (Aguiar & Hurst, 2007; Kool & Botvinick, 2014; Eurofound, 2016; etc.). In contrast, personal time can be defined as the time left over from work, i.e., time devoted to unpaid work, including various forms of leisure (Douglas & Morris, 2006; Newman et al., 2013; Eisenhauer, 2014; etc.). However, it is not enough in the scientific discourse to analyse work-life time separately. In practice, these areas are often related and intertwined. This inevitably leads to the need to combine these areas of time allocation. For the purposes of this paper, work-life balance is understood as the balancing of work and personal life, taking into account personal preferences and the demands of external factors.
Work-life balance is particularly relevant among self-employed persons. On the one hand, these individuals have the opportunity to independently allocate their time to work and personal life. On the other hand, this can often result in work-life conflict and the resulting negative consequences for both work and personal life. Researchers also identify that work-life conflict is often encountered in the pursuit of work-life responsibilities and goals and in the balancing of work roles (Mladenović & Krstić, 2021; Owens-Horton, 2022). According to Seshadrinathan (2021) and Rashid et al. (2022), physical health problems and dissatisfaction with life are among the consequences of work-life conflict. Aspects of job dissatisfaction and quality of life are also noteworthy (Makabe et al., 2015).
It is therefore appropriate to analyse this specific category of the employed population. Self-employed persons are defined as the employed population aged 15 years and over, whether or not they are employed, do not receive a wage but receive an appropriate income or a share of the profit and fulfil at least one of the following criteria: own their own business, have a business license, are farmers (State Data Agency, 2017).
Happiness and Its Components
In the scientific literature, happiness is often understood as satisfaction with life as a whole (Veenhoven, 2017; Plagnol, 2010; Yashina, 2015; etc.). In order to concretise the concept of happiness as an economic phenomenon, two components are identified: job satisfaction and personal life satisfaction. This is also indicated by such scientists as Gröpel (2005), Kumari and Selvi (2016) and others.
Researchers, such as Randhawa and Narang (2018), Crespi-Vallbona and Mascarilla-Miró (2018), Aziz et al. (2021), Seshadrinathan (2021), Alzougool and Awawdeh (2022) and others, usually define job satisfaction as the employee’s feeling at work, i.e., it describes the employee’s satisfaction/dissatisfaction with his/her paid work. Personal life satisfaction is the opposite concept to job satisfaction.
In this article, based on bottom-up interaction theory, an individual can feel fully happy if and only if he or she feels satisfaction at work and satisfaction with his personal life. In this case, the person experiences overall satisfaction with life and this enables the person to feel fully happy.
Links Between Work-Life Time Allocation and the Economic Phenomenon of Happiness
Historical perspective: the debate on work-life balance started in the 1970s with the first use of the term work-life balance (Fernandez-Crehuet et al., 2016). In addition, in the second half of the 20th century, a more intense dissemination of time allocation research is observed (Colella & Van Soest, 2013). The 1970s are also a special year for the analysis of the phenomenon of happiness: Easterlin revisited the concept of happiness from an economic point of view (Graham, 2005; Coyne & Boettke, 2006; Atherton, 2012; etc.). Thus, the scientific direction of happiness economics and the principles related to it began to take shape in the late 20th and early 21st centuries (Navaitis & Gaidys, 2016). Although the emergence of time allocation research can be traced back to the late 19th and early 20th centuries (Mrkić, 2008; Gershuny, 2011). However, research on time allocation began earlier than research on the economics of happiness. On the other hand, the second decade of the 21st century is important in the context of both phenomena, as there has been an increase in the diffusion of research on time allocation and research on the economics of happiness (separately).
The role of time: Aaker et al. (2010), Van Praag and Ferrer-i-Carbonell (2011), Etkin and Mogilner (2016) and other researchers emphasize the importance of time in the concept of happiness. According to Aaker et al. (2010), time is a key element in understanding the concept of happiness. In other words, only by including the time component in the analysis can the concept of happiness be fully identified (Galay, 2007).
Etkin and Mogilner (2016) elaborate on happiness in relation to time: the time allocation decisions made by busy populations have a significant impact on their happiness. Van Praag and Ferrer-i-Carbonell (2011) emphasize the importance of time spent on leisure and work when studying the concept of happiness. Scientists indicate that individuals usually seek to optimise their time allocation in order to achieve happiness. Hence, the concept of happiness can be complemented by the time dimension: happiness in the broadest sense is the satisfaction with life (as a whole) through the appreciation and rational use and allocation of a limited economic resource – time. Happiness in the narrow sense is a comprehensive satisfaction with work and personal life, with the rational use and allocation of a limited economic resource – time.
Structural aspects: the concept of happiness in the narrow sense can be looked at from another angle. This concept is based on the division of a person’s entire life into two main areas of life: job satisfaction and personal life satisfaction. A similar categorization has been made in the analysis of the allocation of time between work and personal life. Hence, time allocation to work and personal life and happiness are structurally similar and interrelated.
In a substantive sense, the allocation of time for work and personal life can also be linked to happiness. For example, Lyubomirsky et al. (2005) point out that happy people successfully combine different activities. Hence, happy people can achieve work-life balance. The concept of work-life balance is related to happiness: the ability to balance the two main areas of time allocation, while experiencing satisfaction at work and personal life (Lazăr et al., 2010; Holly & Mohnen, 2012). In this case, the employed population does not face the negative consequences of work-life conflict. On the contrary, he or she experiences harmony and happiness due to the ability to optimise the allocation of time between work and personal life.
Agha et al. (2017) note that a fulfilling work-life balance only exists when a busy population feels happy because of the harmony of time allocated to work and personal life and the effective fulfilment of these two commitments. One of the main consequences of work-life balance is that the employed population is satisfied with work and personal life (Nguyen, 2013; Van der Zwana et al., 2015; etc.). Nguyen (2013) refers to this situation as the balance of satisfaction: the harmony that is achieved when there is satisfaction with work and personal life. In other words, work-life balance ensures overall life satisfaction, i.e., happiness (Rego & e Cunha, 2009; Rantanen et al., 2011; Holly & Mohnen, 2012; etc.). This logical sequence is based on the principle of upward interaction theory.
Research Methodology
The empirical research presented in this paper is carried out under the following methodological assumptions:
1. The target group of the employed population of the empirical study is the self-employed persons (the definition is presented in the theoretical part of this article). The decision to study this category of the employed population was made because the self-employed received relatively less attention in the scientific literature. Moreover, this category of the employed population is extremely significant and constantly increasing in the 21st century. For example, in 2019, almost 14 percent of the employed population in Lithuania consisted of self-employed persons (excluding farmers), and in 2020 this indicator reached almost 15 percent (State Data Agency, 2023). Thus, taking into account the growing potential of this category of the employed population, the self-employed are analysed in more detail in this article.
2. In the research, the case of Lithuania is not chosen randomly, as there are not enough studies of this kind in Lithuania or they are focused on another target group, period, etc.
3. A person is satisfied with his or her work, satisfied with his or her personal life and happy when his or her levels of job satisfaction, personal life satisfaction and happiness are respectively not less than 9 points, but not more than 10 points (on a 10-point scale).
4. Primary data was collected using a questionnaire survey and a time diary.
5. The methodological aspects of the questionnaire survey are based on the research methodology of the Harmonized European Time Use Survey (hereinafter – HETUS; 2007) and on the contributions of the authors of the study in order to realise the purpose of the study. Seven categories of questions (control questions of the respondent; needs of the respondent; satisfaction with work, personal life and aspects of happiness; knowledge of the respondent about the economics of happiness, concepts and basic principles of time allocation; salary; substitution/income effect; demographic, general questions) were formulated in the questionnaire survey. Due to the limited scope of this paper, only a small part of the empirical data of the questionnaire survey is analysed in more detail in the article.
6. A time diary is used to collect the primary data on time allocation and is filled in on two calendar days: one working day and one day off. In the time diary, the following main areas of time allocation are distinguished: sleep; other physiological needs; work; education/study/self-education; home care; family care; leisure; travel; other activities. This allocation of daily time is based on previous research and the research methodology of HETUS (2007).
7. The data collected through questionnaire survey and time diary are interpreted as average daily time allocation data in 2019, since the data were collected from 2 September to 30 November 2019.
8. The results of the survey reflect the population of self-employed persons in Lithuania with a 97 percent probability. The survey covered 1073 respondents by type of economic activity, place of residence, gender, age, and type of person. Criterion, quota, random, “snowball” sampling methods are used in the research.
9. The respondents were rational, open and honest.
10. Pearson’s correlation coefficient (ρ) is used for correlation analysis with a 95 percent probability.
11. SPSS was used for data processing and analysis.
The respondent was mostly a self-employed person in Vilnius county (51.4 percent; in the capital of Lithuania) and in the service sector (51.4 percent). The most frequent person was male (60.9 percent), falling into 25–54 age category (71.5 percent). The respondent usually had two children (38.0 percent) or no children (36.1 percent). Years of work experience ranged from 0 years (0.7 percent) to 45 years (0.7 percent) but was mostly equal to 30 years (9.3 percent). The respondent usually had a higher (bachelor’s degree) education (55.2 percent). In terms of the type of self-employed activity, the most common type of activity was sole proprietorship (38.1 percent) or business licence (37.1 percent).
The article tests two scientific hypotheses at a significance level of 0.05.
H11: The average daily sleep time varies between self-employed persons aged 15–24 years and older.
The hypothesis is confirmed if the average daily sleep time for self-employed persons aged 15–24 years and older (25 years and over) are statistically significantly different at p<0.05. The non-parametric Mann-Whitney U test is applied.
In the traditional work-rest cycle, sleep is one of the most important areas of personal life, thus, the allocation of time for sleep is being studied. In line with recommendations from the medical field (e.g., Hirshkowitz et al., 2015), younger people should spend more time on sleep than representatives of other age groups. In this study, the youngest age group is 15–24 years old people. For this reason, time devoted to sleep is studied in terms of age in order to identify possible differences between 15-24-year-olds and older.
H21: There is a relationship between self-employed individuals who seek to balance work and personal life and the level of happiness.
The hypothesis is confirmed if there is a statistically significant relationship between the studied variables, p<0.05. The X2 criterion is applied.
It is assumed that individuals who strive for work-life balance represent individuals who, on an empirical level, have a good work-life balance. For this reason, it becomes relevant to find out whether this type of person is happy.
Results and Discussion
Time Allocation to Work and Personal Life
Self-employed persons in Lithuania spent on average 77.5 percent of their daily time on personal life and 22.5 percent on work in 2019 (see Figure 1).
Figure 1
Distribution of daily time of self-employed persons in Lithuania (2019)
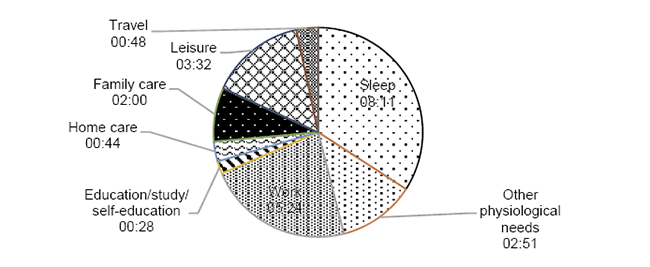
Note: No time is allocated for other activities. Rounding may result in an error of 00:02 hours.
The relationship between time spent on work and time spent on personal life is positive. The opposite situation, according to Makabe et al. (2015), would be identified if the time devoted to work exceeds the time devoted to personal life. Accordingly, this could lead to lower job satisfaction and, ultimately, to a feeling of happiness. However, Baucells and Sarin (2007), Taneja (2013) and other researchers find a trend of increasing hours at work and decreasing time spent on personal life. On the other hand, Ramey and Francis (2009) emphasize the opposite finding: time devoted to work is characterized by a decreasing trend.
In terms of personal life, sleep (34.1 percent) and leisure (14.7 percent; see Figure 1) are the most important activities. The results of the study also meet the recommendations of Hirshkowitz et al. (2015): time spent per day on sleep for 18-64-year-olds should fall within the following range: [07:00-09:00 hours]. However, according to the European Society of Cardiology (2018), sleeping less than 06:00 hours a day can lead to a variety of health problems over time. However, the time devoted to sleep has a decreasing trend: in the 20th century, the average daily time spent sleeping decreased from approximately 09:00 hours to 06:05 hours.
When studying the time spent on sleep by age category, it was identified that 15-24-year-olds spend the most time on this time period (08:41; 25-54-year-olds: 08:12; 55-24-year-olds: 08:03; 65+ year olds: 08:20). With a 95 percent probability, it has been determined that the average daily sleep time between self-employed persons aged 15–24 and older varies in Lithuania (p<0.05; H11 confirmed). This means that young people (15–24 years old) spend significantly more time sleeping than older people. This is possibly one of the reasons why this group of people is the happiest and most satisfied with their personal life compared to other age groups.
When looking at the relationship between time spent at work and age, a statistically significant (p<0.05) but very weak (ρ=0.137) positive relationship was found with a 95 percent probability between these variables. In other words, the older the person, the more time is devoted to work (or vice versa). A different result is obtained by Ben David and Tur-Sinai (2017): employees aged 61 work on average 01:48 hours less than employees aged 41. However, this finding is logical, because employees aged 50–55 spend relatively more time on work, and then the time spent on work decreases as the time spent on personal life increases.
Among all age groups, those aged 15–24 spend the most time per day on their personal life (80.0 percent), while those aged 55–64 spend the most time on work (23.5 percent; see Figure 2).
Figure 2
Time allocation for work and personal life of the self-employed persons in Lithuania (2019)
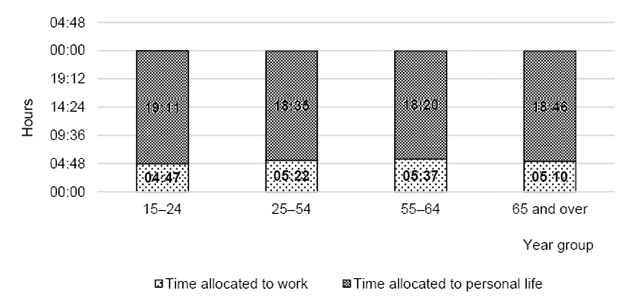
Note: rounding can cause an error of 00:02-00:04 hours.
These differences in time allocation are rational and support the theoretical concepts that personal time dominates in young and old age. According to the results of this study, the youngest (15–24 years; 80.0 percent) and the oldest (65 years and older; 78.4 percent) people spend the most time on personal life per day. Conversely, the working age groups (25–54 and 55–64) are the most likely to spend the most time per day at work (22.4 percent and 23.5 percent, respectively). In the context of personal life, the most time in all age groups per day is devoted to sleep and leisure.
It was found that the more time spent on work, the less time spent on sleep (ρ=- 0.364); education/study/self-education (ρ=-0.180); home care (ρ=-0.214); family care (ρ=-0.288); leisure (ρ=-0.306; the cause-and-effect relationship may be inversely related). It is worth noting the insights of Lajtman (2016): the more time is devoted to work, the more often work-life conflict is identified. And according to Aziz and Cunningham (2008), long working hours lead to workaholism.
Investigating the distribution of time by gender, it was found that 77.2 percent of women devotes daily time to personal life and 22.8 percent to work, while men spend 77.6 percent of their daily time on personal life and 22.4 percent on work. However, men spend more time (00:05 hours) per day on personal life, while women spend more time on work. This fact contradicts the classical distribution of time between the genders, which is also emphasized by Rubiano-Matulevich and Kashiwase (2018). According to the results of this study, men dominate in personal life, while women dominate at work (in terms of time).
Similar results have been obtained by Brunnich et al. (2005), Booth and Van Ours (2007), OECD (2011) and other researchers. Ramey and Francis (2009) find that time devoted to work tended to increase over time. This increase was associated with an increase in women’s time devoted to work, while men’s time devoted to work decreased. However, Yokying et al. (2016) point out that long working hours are a serious problem among women. All of these have negative effects on health and productivity. Differences between men and women are not always identifiable in terms of time spent on work. For example, Burke and El‐Kot (2009) find that men and women spend similar amounts of time on work. The opposite results are obtained by Fagan et al. (2012), Eurofound (2016), Hamermesh (2019) and other researchers: women spend more time on personal life than men.
Happiness and Its Components
Self-employed persons felt happy in 2019: the majority of respondents (29.9 percent) indicated a happiness level of 9 points (see Table 1).
Table 1
Levels of happiness, job satisfaction and personal life satisfaction of self-employed persons in Lithuania (2019)
|
Scores |
Happiness level |
Level of job |
Level of satisfaction |
|
1 |
0.1% |
0.0% |
0.2% |
|
2 |
0.2% |
2.2% |
1.1% |
|
3 |
0.6% |
2.8% |
1.7% |
|
4 |
4.7% |
8.4% |
4.8% |
|
5 |
11.2% |
7.7% |
7.7% |
|
6 |
12.9% |
7.5% |
8.5% |
|
7 |
10.4% |
6.7% |
7.8% |
|
8 |
20.4% |
23.1% |
22.7% |
|
9 |
29.9% |
30.4% |
31.0% |
|
10 |
9.7% |
11.2% |
14.4% |
Note: rounding can lead to an error of 0.1 percent.
The results of this study are in line with the findings of Karalevičiūtė (2019): 90 percent of Lithuanians feel happy. Plepytė-Davidavičienė (2020) points to a similar level of Lithuanian happiness in a dynamic context: although the level of Lithuanian happiness tends to increase from 79 percent (1999) to 83 percent (2017), it is one of the lowest in Europe. On the other hand, when comparing the results of the study with the “World Happiness Report” by Helliwell et al. (2022), differences are identified: the average level of happiness is 6.5 points in Lithuania. The differences could be due to the time period of the study (2019–2021) and other methodological aspects. At the global level, Lithuania is ranked 34th out of 146.
The self-employed persons are also satisfied with their work and usually rate it with 9 points (30.4 percent; see Table 1). According to the results of a study by Telešienė (2015), the level of job satisfaction in general tends to increase, when comparing 2009, 2011 and 2013. On the other hand, at the European level, 58 percent of individuals feel job satisfaction (Eurofound, 2016). The differences in the research results are likely to be due to research methodology.
Self-employed persons are satisfied with their personal life, most often reporting a level of satisfaction with their personal life of 9 points (31.0 percent; see Table 1). According to the analysis of Telešienė (2015), satisfaction with personal life in Lithuania tends to increase, when comparing 2009, 2011 and 2013.
Men (29.9 percent) and women (30.0 percent) also tend to have a happiness level of 9-point. The results of the study are in line with Booth and Van Ours (2007), Ono and Lee (2013): women and men are equally happy. Different conclusions are presented by Tiefenbach and Kohlbacker (2015), Knight and Gunatilaka (2017), Karalevičiūtė (2019) and other authors: women are happier than men.
The dominant choice of 9 points for job satisfaction is observed among women (29.8 percent) and men (30.8 percent). However, men are more satisfied with their work. Kaiser (2007), Booth and Van Ours (2007) obtained the opposite results: women experience higher job satisfaction than men.
A similar situation in terms of satisfaction with personal life can be observed when analysing the choices of women (31.2 percent) and men (30.9 percent): the most frequent reported satisfaction with personal life is equal to 9 points. On the other hand, women are more satisfied with their personal life than men. The results of this study are in line with Richiţeanu-Năstase et al. (2018). However, the opposite results are obtained by Holly and Mohnen (2012), Ebrahim et al. (2013).
Although self-employed persons in Lithuania were happy across all age groups in 2019, with the most frequent reporting a 9-point happiness level, those aged 15–24 are relatively the happiest (42.9 percent; 25–54 years: 30.0 percent; 55–64 years: 26.9 percent; persons 65 years and older: 35.3 percent). The results of the study are consistent with Ilyukhin and Ilyukhina (2018). This type of situation may be influenced by the highest monthly net income (901–1100 euros) compared to other age groups. This relationship between age and happiness can be complemented by Easterlin’s (2006) insights: happiness tends to increase up to age 51, after which there is a downward trend.
According to different age groups, a dominant option is also identified: job satisfaction equal to 9 points (15–24 years: 32.1 percent; 25–54 years: 31.3 percent; 55–64 years: 26.4 percent; 65 years and over: 33.3 percent). Those aged 65 and over are the most satisfied with their work, while those aged 55–64 are least satisfied. This can be explained on the basis of the life-cycle theory, which suggests that at the age of 50–55 individuals reach a peak wage and thereafter wages tend to fall or remain unchanged. This is likely to be the case without an increase in financial resources, regardless of how much effort and time a person puts into work. It is likely that those aged 65 and older persons have accumulated sufficient financial resources and are more likely to experience income effects.
According to age groups, a score of 9-point for personal life satisfaction is predominant (15–24 years: 42.9 percent; 25–54 years: 30.9 percent; 55–64 years: 28.2 percent; 65 years and older: 39.2 percent). Those aged 15–24 are the most satisfied people with their personal life. This probably related to life cycle aspects. At the youngest age, most of the time should be devoted to personal life rather than to work. All this is also reflected in this study: 15-24-year-old individuals spend the most time per day on personal life (80 percent of the daily time) than individuals of other age groups.
Relationship between the Allocation of Time to Work and Personal Life with the Level of Happiness
With a 95 percent probability, a statistically significant (p<0.05) relationship was found between self-employed persons’ work-life balance and their level of happiness (H21 confirmed). Hence, the theoretical assumptions are empirically confirmed. It can be argued that the insights of Rego and e Cunha (2009) are consistent with the findings: the level of happiness of employees can be reduced by work-life imbalance.
However, leisure is important in the context of happiness: there is a statistically significant (p<0.05), but very weak (ρ=-0.073) negative relationship between the average daily time devoted to leisure and the level of happiness at a 95 percent confidence level. In other words, the more time spent on leisure, the less happiness is felt (or vice versa). The opposite finding is obtained by Wei et al. (2015) and Karalevičiūtė (2019).
The findings show that there is a 95 percent probability of a statistically insignificant (p>0.05) relationships between the average daily time devoted to work and the level of happiness; the average daily time devoted to personal life and the level of happiness. The results of this study on time devoted to work and the level of happiness agree with the findings of Ryu (2016). However, Di Tella and MacCulloch (2005), Fallon-Hogan (2013), Knight and Gunatilaka (2017) and other authors point out that time spent at work negatively affects happiness. These discrepancies may be due to different study context.
There is a 95 percent probability of a statistically insignificant (p>0.05) relationships between age and the level of happiness, the level of job satisfaction, the level of satisfaction with personal life. The results of the study on the correlation between age and level of happiness are in line with the findings of Mendes-Da-Silva et al. (2013). The cognitive field of the relationship between happiness and age can be supplemented by the insights of Frey and Stutzer (2002): young people are less happy than older people. This can be expanded upon by Tiefenbach and Kohlbacker (2015), Graham and Pozuelo (2017), Knight and Gunatilaka (2017), etc.: there is a U-shaped relationship between happiness and age. According to Graham et al. (2010), the lowest point is reached at the age of 47.
Baetschmann (2013) takes a different point: the level of happiness tends to decrease from the age of 20 up to 55 and continues to increase up to age of 70. Navaitis et al. (2014), in their study of the Lithuanian labour market, provide a more detailed correlation between happiness and age: 18-29-year-olds are the happiest; those aged 30–39 have a similar level of happiness, while the remaining age groups have lower levels of happiness. However, Gerdtham and Johannesson (2001) find out that the level of happiness is the lowest between the ages of 45–64. However, the findings of this study do not agree with Stanca (2010) who indicates that age and happiness, satisfaction with personal life is negatively correlated with each other.
Summarizing the empirical study, it can be stated that in 2019 self-employed persons in Lithuania spent 77.5 percent of their daily time to personal life (mostly to sleep and leisure time) and 22.5 percent – for work. Those aged 15-24 spend relatively the most time on sleep, and their time spent on sleep is statistically significantly different from other age groups with a 95 percent probability (H11 confirmed). In terms of gender, it was found that men spend relatively more time on their personal life, while women spend more time on work. However, men are more satisfied with their work and women are more satisfied with their personal life. Despite these differences, it was identified that in 2019 self-employed persons in Lithuania were mostly happy, satisfied with their work and satisfied with their personal life. In the context of age, those aged 15–24 were the happiest. After performing a statistical analysis, it turned out that there was a 95 percent probability of a statistically significant relationship between the level of work-life balance and the level of happiness among the self-employed persons (H21 confirmed). Hence, work-life balance is likely to be important for happiness (or vice versa).
Conclusions
A review of the scientific literature has shown that time can be correctly classified into work and personal time. Only by reconciling these two domains of time can guarantee harmony and harmony leading to work-life balance. Happiness is another phenomenon explored in this article. It has been found that job satisfaction and personal life satisfaction can be identified as components of happiness. However, a person can only feel the satisfaction of work and satisfaction of personal life, and ultimately feel happy, only if the time between work and personal life is properly balanced.
From a methodological point of view, the target group of the empirical study is self-employed persons in Lithuania. The research was carried out using the analysis of scientific literature, questionnaire survey, time diary, statistical data analysis, comparative analysis, correlation analysis, non-parametric Mann-Whitney U test, X2 criterion.
Empirically studying the time allocation of self-employed persons in Lithuania, it was found that in 2019 77.5 percent of these persons devoted time of the day to personal life (mostly to sleep and leisure time) and 22.5 percent – to work. With a 95 percent probability, it was found that time allocated to sleep (08:41) between the ages of 15 and 24 is statistically significantly different from other age groups (H11 confirmed). From a statistical point of view, these individuals sleep the longest during the day. On the other hand, women devote more time to work and men to personal life.
Although mostly in 2019 self-employed persons were happy, satisfied with their work and satisfied with their personal life, but 15-24-year-olds were the happiest. However, men were more satisfied with their work and women with their personal life. With a 95 percent probability, it was found that there was a statistically significant relationship between self-employed persons seeking to balance work and personal life and the level of happiness (H21 confirmed).
The main limitations of the study are related to methodological aspects: difficulties in primary data collection (time, knowledge and opportunities) and processing. This article examines the population of self-employed persons in Lithuania (2019), and the study population of HETUS, whose methodology is based on this study, is the entire population of 15 European countries (1998–2006). In addition, the duration of empirical data collection does not match the methodology of the HETUS study. In the present study, questionnaire survey and time diary data were collected for almost three months, but not for one year, as was done in the HETUS study in the case of Lithuania (January 2003 – December 2003). The main discrepancies between the content and structure of the questionnaire survey applied in this article and the methodology used in the HETUS study are related to the fact that only an individual survey is used in this study. And the questions are reasonably adjusted, taking into account the collection of data necessary to achieve the objective of the empirical study. The content and structure of the time diary were also modified according to the purpose of the study and the need for relevant empirical data.
Further lines of research could be related to the application of an analogous methodology to another study population and/or another country. Also, in the future, in-depth analysis of a dynamic nature could be performed. The conclusions obtained during the research could be useful at the macroeconomic level, improving the social security and labour policy, its strategy, etc.
References
Aaker, J.L., Rudd, M., & Mogilner, C. (2011). If money doesn’t make you happy, consider time. Journal of Consumer Psychology, 21(2), 126–130. https://doi.org/10.1016/j.jcps.2011.01.004
Abubaker, M., Luobbad, M., Qasem, I., & Adam-Bagley, C. (2022). Work–life-balance policies for women and men in an islamic culture: a culture-centred and religious research perspective. Businesses, 2(3), 319–338. https:// doi.org/10.3390/businesses2030021
Agha, K., Azmi, F.T., & Irfan, A. (2017). Work-life balance and job satisfaction: An empirical study focusing on higher education teachers in Oman. International Journal of Social Science and Humanity, 7(3), 164–171. https://doi.org/10.18178/ijssh.2017.7.3.813
Aguiar, M., & Hurst, E. (2007). Measuring trends in leisure: The allocation of time over five decades. Quarterly Journal of Economics, 122(3), 969–1006. https://doi.org/10.1162/qjec.122.3.969
Alzougool, B., & Awawdeh, L. (2022). Job satisfaction among non-academic staff in Kuwait. Journal of Management Information & Decision Sciences, 25(6), 1–8.
Atherton, J. (2012). Happiness and religious capital: expanding economic and related discourses. Homo Oeconomicus, 29(1), 13–24.
Austen, A. (2022) Work-life balance and work overload in a pandemic world, scientific papers of silesian university of technology. Organization & Management, 163, 9–20. http://dx.doi.org/10.29119/1641-3466.2022.163.1
Aziz, H.M., Othman, B.J., Gardi, B., Ahmed, S.A., Sabir, B.Y., Ismael, N.B., Hamza, P.A., Sorguli, S., Ali, B.J., & Anwar, G. (2021). Employee commitment: The relationship between employee commitment and job satisfaction. Journal of Humanities and Education Development, 3(3), 54–66. https://doi.org/10.22161/jhed.3.3.6.
Aziz, S., & Cunningham, J. (2008). Workaholism, work stress, work-life imbalance: exploring gender’s role. Gender in Management: An International Journal, 23(8), 553–566. https://doi.org/10.1108/17542410810912681
Baetschmann, G. (2013). Heterogeneity in the relationship between happiness and age: evidence from the german socio-economic panel. German Economic Review, 15(3), 393–410. https://doi.org/10.1111/geer.12015
Bahrami, P., Nosratabadi, S., Palouzian, K., & Hegedűs, S. (2023). Modeling the impact of mentoring on women’s work-life balance: a grounded theory approach. Administrative Sciences, 13(1), 2076–3387. https://doi.org/10.3390/admsci13010006
Baucells, M., & Sarin, R.K. (2007). Happiness and time allocation. IESE Working Paper, No. 710, IESE Business School. https://media.iese.edu/research/pdfs/DI-0710-E.pdf on January 15, 2023.
Ben David, N.B., & Tur-Sinai, A. (2017). Determining the optimal allocation of time among work, sports, internet use, and sleep. International Journal of Social Economics, 44(12), 2067–2085. https://doi.org/10.1108/IJSE-08-2015-0215
Booth, A.L., & Van Ours, J.C. (2007). Job satisfaction and family happiness: The part-time work puzzle. ISER Working Paper Series, No. 2007-20.
Brunnich, G., Druce, P., Ghissassi, M., Johnson, M., Majidi, N., Radas, A.L., Riccheri, P.R., De Sentenac, C., & Vacarr, D. (2005). Three case studies of time use survey application in lower and middle-income countries. http://www.levyinstitute.org/undp-levy-conference/papers/paper_Vacarr.pdf on February 22, 2023.
Burke, R.J., & El‐Kot, G. (2009). Work intensity, work hours, satisfactions, and psychological wellbeing among Egyptian managers. Education, Business and Society: Contemporary Middle Eastern Issues, 2(3), 218–231. https://doi.org/10.1108/17537980910981787
Cho, Y., Park, J., Ju, B., Han, S.J., Moon, H., Park, S., Ju, A., & Park, E. (2016). Women leaders’ work-life imbalance in South Korean companies: a collaborative qualitative study. Human Resource Development Quarterly, 27(4), 461–487. https://doi.org/10.1002/hrdq.21262
Coyne, C.J., & Boettke, P.J. (2006). Economics and happiness research: Insights from Austrian and public choice economics. http://www.ccoyne.com/happiness_and_economics.pdf on January 1, 2023.
Colella, F., & Van Soest, A. (2013). Time use, consumption expenditures and employment status: evidence from the LISS panel. Paper presented at the 2013, 7th MESS Workshop, Den Haag.
Crespi-Vallbona, M., & Mascarilla-Miró, O. (2018). Job satisfaction. The case of information technology (IT) professionals in Spain. Universia Business Review, 58, 36–51. https://doi.org/10.3232/UBR.2018.V15.N2.02
Di Tella, R., & MacCulloch, R. (2005). Gross national happiness as an answer to the easterlin paradox? http://www.people.hbs.edu/rd itella/papers/wpgnhappiness.pdf on February 22, 2023.
Douglas, E.J., & Morris, R.J. (2006). Workaholic, or just hard worker? Career Development International, 11(5), 394–417. https://doi.org/10.1108/13620430610683043
Easterlin, R.A. (2006). Life cycle happiness and its sources: Intersections of psychology, economics, and demography. Journal of Economic Psychology, 27(4), 463–482. https://doi.org/10.1016/j.joep.2006.05.002
Ebrahim, A., Botha, F., & Snowball, J. (2013). Determinants of life satisfaction among race groups in South Africa. Development Southern Africa, 30(2), 168–185. https://doi.org/10.1080/0376835X.2013.797227
Eisenhauer, J.G. (2014). Labor supply with Friedman-Savage preferences. Studies in Economics and Finance, 31(2), 186–201. https://doi.org/10.1108/SEF-08-2012-0095
Etkin, J., & Mogilner, C. (2016). Does variety among activities increase happiness? Journal of Consumer Research, 43(2), 210–229. https://doi.org/10.1093/jcr/ucw021
Eurofound. (2016). Eurofound yearbook 2015: Living and working in Europe. Luxembourd: Publications Office of the European Union.
European Society of Cardiology. (2018). Finding the sweet spot of a good night’s sleep: not too long and not too short. https://www.escardio.org/The-ESC/Press-Office/Press-releases/Finding-the-sweet-spot-of-a-good-night-s-sleep-not-too-long-and-not-too-short on February 22, 2023.
Fagan, C., Lyonette, C., Smith, M., & Saldaña-Tejeda, A. (2012). The influence of working time arrangements on work−life integration or “balance”: A review of the international evidence. https://www.auca.kg/uploads/Migration/digest_26/04.pdf on February 22, 2023.
Fallon-Hogan, V. (2013). An examination of working hours, work-life conflict and psychological well-being in Irish academics. Dissertation. National University of Ireland. http://hdl.handle.net/10379/4302 on February 22, 2023.
Fernandez-Crehuet, J.M., Gimenez-Nadal, J.I., & Recio, L.E.R. (2016). The national work-life balance index©: the European case. Social Indicators Research, 128(1), 341–359. https://doi.org/10.1007/s11205-015-1034-2
Frey, B.S., & Stutzer, A. (2002). What can economists learn from happiness research? Journal of Economic Literature, 40(2), 402–435.
Galay, K. (2007). Patterns of time use and happiness in Bhutan: Is there a relationship between the two? Working Paper, No. 432.
Gerdtham, U.G., & Johannesson, M. (2001). The relationship between happiness, health, and socio-economic factors: Results based on Swedish microdata. Journal of Socio-Economics, 30(6), 553–557.
Gershuny, J. (2011). Time-use surveys and the measurement of national well-being. https://www.ons.gov.uk/ons/rel/environmental/time-use-surveys-and-the-measurement-of-national-well-being/article-by-jonathan-gershuny/new-component.pdf on February 22, 2023.
Graham, C. (2005). The economics of happiness. World Economics, 6(3), 41–55.
Graham, C., Chattopadhyay, S., & Picon, M. (2010). Adapting to adversity: Happiness and the 2009 economic crisis in the United States. Social Research, 77(2), 715–748.
Graham, C., & Pozuelo, J.R. (2017). Happiness, stress, and age: how the U curve varies across people and places. Journal of Population Economics, 30(1), 225–264. https://doi.org/10.1007/s00148-016-0611-2
Gröpel, P. (2005). On the theory of life balance: The relation to subjective well-being and the role of self-regulation. Dissertation. University of Osnabrück. http://worlddatabaseofhappiness.eur.nl/hap_bib/freetexts/gr%C3%B6p el_p_200 5.pdf on January 1, 2023.
Hamermesh, D.S. (2019). Spending time– the most valuable resource. Oxford: Oxford University Press.
Helliwell, J.F., Layard, R., Sachs, J.D., De Neve, J.E., Aknin, L.B., & Wang, S. (2022). World Happiness Report 2022. New York: Sustainable Development Solutions Network.
HETUS. (2007). Harmonised European Time Use Survey. Main Activities. https://www.h6.scb.se/tus/tus/StatMeanMact1.html on July 26, 2022.
Hirshkowitz, M., Whiton, K., Albert, S.M., Alessi, C., Bruni, O., DonCarlos, L., Hazen, N., Herman, J., Katz, E.S., Kheirandish-Gozal, L., Neubauer, D.N., O’Donnell, A.E., Ohayon, M., Peever, J., Rawding, R., Sachdeva, R.C., Setters, B., Vitiello, M.V., Ware, J.C., & Hillard, P.J.A. (2015). National Sleep Foundation’s sleep time duration recommendations: methodology and results summary. Sleep Health, 1(1), 40–43. https://doi.org/10.1016/j.sleh.2014.12.010
Holly, S., & Mohnen, A. (2012). Impact of working hours on work–life balance. SOEPpapers on Multidisciplinary Panel Data Research, No. 465.
Ilyukhin, A.A., & Ilyukhina, S.V. (2018). Happiness economics: The role, opinions and evaluations by young people. Upravlenec, 9(2), 12–17.
Kaiser, L.C. (2007). Gender‐job satisfaction differences across Europe: An indicator for labour market modernization. International Journal of Manpower, 28(1), 75–94. https://doi.org/10.1108/01437720710733483
Kaliannan, M., Perumal, K., & Dorasamy, M. (2016). Developing a work-life balance model towards improving job satisfaction among medical doctors across different generations. The Journal of Developing Areas, 50(5), 343–351. https://doi.org/10.1353/jda.2016.0035
Karalevičiūtė, K. (2019). Tas saldus žodis laimė. Žurnalas „Laimė“, 18–21.
Knight, J., & Gunatilaka, R. (2017). Is happiness infectious? Scottish Journal of Political Economy, 64(1), 1–24. https://doi.org/10.1111/sjpe.12105
Kool, W., & Botvinick, M. (2014). A labor/leisure tradeoff in cognitive control. Journal of Experimental Psychology, 143(1), 131–141. https://doi.org/10.1037/a0031048
Kumari, S.V., & Selvi, A.M. (2016). The impact of work-life balance on the wellbeing of employees in the telecom sector. International Journal of Science and Research, 5(2), 597–601.
Lajtman, M.K. (2016). Impact of personal factors on the work life conflict and its co-influence with organizational factors on employee commitment in Croatia. Dissertation. University of St. Gallen. https://www1.unisg.ch/w ww/edis.nsf/SysLkpByIdentifier/4529/$FILE/dis4529.pdf on January 1, 2023.
Lazăr, I., Osoian, C., & Raţiu, P. (2010). The role of work-life balance practices in order to improve organizational performance. European Research Studies, 13(1), 201–214.
Lyubomirsky, S., King, L., & Diener, E. (2005). The benefits of frequent positive affect: Does happiness lead to success? Psychological Bulletin, 131(6), 803–855. https://doi.org/10.1037/0033-2909.131.6.803
Makabe, S., Takagai, J., Asanuma, Y., Ohtomo, K., & Kimura, Y. (2015). Impact of work-life imbalance on job satisfaction and quality of life among hospital nurses in Japan. Industrial Health, 53(2), 152–159. https://doi.org/10.2486/indhealth.2014-0141
Mendes-Da-Silva, W., Onusic, L.M., Norvilitis, J.M., & Moura, G.L. (2013). Focusing illusion in satisfaction with life among college students living in Brazil. Rae: Revista De Administração De Empresas, 53(5), 430–441.
Mladenović, M., & Krstić, B. (2021). Interrelationship between work and private life of employees – conflict or balance? Economics and Organization, 18(3), 299–311. https://doi.org/10.22190/FUEO210505021M
Mousa, M. (2018). Inspiring a work-life balance: Responsible leadership among female pharmacists in the Egyptian health sector. Entrepreneurial Business and Economics Review, 6(1), 71–90. https://doi.org/10.15678/EBER.2018.060104
Mrkić, S. (2008). Time use statistics in the context of social statistics. https://millenniumindicators.un.org/unsd/statcom/statcom_08_events/special %20events/New_directions_social/Srdjan_Mrkic_Time_Use_Paper.pdf on February 22, 2023.
Navaitis, G., & Gaidys, V. (2016). Laimės ekonomikos nuostatų sklaida Lietuvos visuomenėje. Filosofija. Sociologija, 27(2), 125–131.
Navaitis, G., Ralys, K., & Gaidys, V. (2014). Tikėjimo ir laimės sąsajos. Socialinis ugdymas, 39(3), 30–38. http://dx.doi.org/10.15823/su.2014.16
Newman, D.B., Tay, L., & Diener, E. (2013). Leisure and subjective well-being: A model of psychological mechanisms as mediating factors. Journal of Happiness Studies, 15(3), 555–578. https://doi.org/10.1007/s10902-013-9435-x
Nguyen, K.T.A. (2013). A case of how adaptation affects the work-life balance of East Asian students in New Zealand. Dissertation. Auckland University of Technology. http://aut.researchgateway.ac.nz/bitstream/handle/10 292/5406/NguyenKTA.pdf?sequence=3&isAllowed=y on 22 February, 2023.
Nilsson, M., Blomqvist, K., & Andersson, I. (2017). Salutogenic resources in relation to teachers’ work-life balance. Work, 56(4), 591–602. http://dx.doi.org/10.3233/WOR-172528
OECD (2011). How’s life? Measuring well-being. Paris: OECD Publishing.
Oludayo, O.A., Falola, H.O., Ahaka, O., & Fatogun, D. (2018). Work-life balance initiative as a predictor of employees’ behavioural outcomes. Academy of Strategic Management Journal, 17(1), 1–17.
Ono, H., & Lee, K.S. (2013). Welfare states and the redistribution of happiness. Social Forces, 92(2), 789–814.
Owens-Horton, A.L. (2022). Work–life balance in parent teachers during COVID-19. Dissertation. Liberty University. https://digitalcommons.liberty.edu/cgi/viewcontent.cgi?article=4566&context=doctoral on February 22, 2023.
Plagnol, A. (2010). Subjective well-being over the life course: Conceptualizations and evaluations. Social Research, 77(2), 749–768.
Plepytė-Davidavičienė, G. (2020). Kaip matuojama laimė? Filosofija. Sociologija, 31(2), 107–116.
Ramey, V.A., & Francis, N. (2009). A century of work and leisure. American Economic Journal: Macroeconomics, 1(2), 189–224.
Randhawa, G., & Narang, K. (2018). Factors influencing job satisfaction of women police personnel in Punjab. Indian Journal of Industrial Relations, 53(4), 630–645.
Rantanen, J., Kinnunen, U., Mauno, S., & Tillemann, K. (2011). Introducing theoretical approaches to work-life balance and testing a new typology among professionals. Chapter 2 in book Creating Balance? International Perspectives on the Work-Life Integration of Professionals, 27–45.
Rashid, M.S., Haar, J., Rashid, M.S., & Shami, G.M. (2022). Work demands, work-life balance and affect: A study of Pakistan managers. New Zealand Journal of Human Resources Management, 22(1), 32–45.
Rego, A., & e Cunha, M.P. (2009). Do the opportunities for learning and personal development lead to happiness? It depends on work-family conciliation. Journal of Occupational Health Psychology, 14(3), 334–348. https://doi.org/10.1037/a0014248
Richiţeanu-Năstase, E.R., Stăiculescu, C., & Lăcătuş, M.L. (2018). Time management skills. Academic achievements and life satisfaction. A case study at Bucharest University of Economic Studies. Review of International Comparative Management, Revista de Management Comparat International, 19(2), 102–108. https://doi.org/10.24818/RMCI.2018.2.102
Ryu, G. (2016). Public employees’ well-being when having long working hours and low-salary working conditions. Public Personnel Management, 45(1), 70–89. https://doi.org/10.1177/0091026015601143
Rubiano-Matulevich, E., & Kashiwase, H. (2018). Why time use data matters for gender equality—and why it’s hard to find. https://blogs.worldbank.org/opendata/why-time-use-data-matters-gender-equality-and-why-it-s-hard-find on February 22, 2023.
Seshadrinathan, S. (2021). Impact of work life conflict on job satisfaction of it employees in Chennai city. Turkish Online Journal of Qualitative Inquiry, 12(6), 8293–8300.
Sriram, K.V, Drisya, R, & Giridhar, K. (2022). Does work environment & work-life balance influence women employees’ intention to stay? Studies in Business & Economics, 17(2), 239–251. https://doi.org/10.2478/sbe-2022-0036
Stanca, L. (2010). The geography of economics and happiness: Spatial patterns in the effects of economic conditions on well-being. Social Indicators Research, 99(1), 115–133. http://dx.doi.org/10.1007/s11205-009-9571-1
State Data Agency. (2017). Savarankiškas darbas. https://osp.stat.gov.lt/documents/10180/0/savarankiskas+darbas_metainfo on February 22, 2023.
State Data Agency. (2023). Indicators database. https://osp.stat.gov.lt/statistiniu-rodikliu-analize#/ on February 22, 2023.
Taneja, S. (2013). Sustaining work schedules: Balancing leisure and work. Academy of Strategic Management Journal, 12(2), 113–122.
Telešienė, A. (2015). Asmeninė ir socialinė subjektyvi gerovė Lietuvoje. Filosofija, Sociologija, 26(4), 293–303.
Tiefenbach, T., & Kohlbacker, F. (2015). Happiness in Japan in times of upheaval: Empirical evidence from the national survey on lifestyle preferences. Journal of Happiness Studies, 16(2), 333–366. https://doi.org/10.1007/s10902-014-9512-9
Vallasek, M. (2021). Working time and work–life balance in Romania during the pandemic. Issues and evolutions. Acta Univ. Sapientiae, Legal Studies, 10, 145–155. https://doi.org/10.47745/AUSLEG.2021.10.1.11
Van der Zwana, P., Hesselsa, J., & Rietvelda, C.A. (2015). The pleasures and pains of self-employment: A panel data analysis of satisfaction with life, work, and leisure. Tinbergen Institute Discussion Paper, 99.
Van Praag, B.M.S., & Ferrer-i-Carbonell, A. (2011). Happiness economics: A new road to measuring and comparing happiness. Foundation and Trends in Microeconomics, 6(1), 1–97. https://doi.org/10.1561/0700000026
Veenhoven, R. (2017). Greater happiness for a greater number: Did the promise of enlightenment come true? Social Indicators Research, 130(1), 9–25. https://doi.org/10.1007/s11205-015-1128-x
Yashina, M. (2015). The economics of happiness: Future or reality in Russia? Studia commercialia Bratislavensia, 8(30), 266–274. https://doi.org/10.1515/stcb-2015-0025
Yokying, P., Sangaroon, B., Sushevagul, T., & Floro, M.S. (2016). Work-life balance and time use: lessons from Thailand. Asia-Pacific Population Journal, 31(1), 87–107.
Wei, X., Huang, S.S., Stodolska, M., & Yu, Y. (2015). Leisure time, leisure activities, and happiness in China. Journal of Leisure Research, 47(5), 556–576. https://doi.org/10.18666/jlr-2015-v47-i5-6120