Organizations and Markets in Emerging Economies ISSN 2029-4581 eISSN 2345-0037
2024, vol. 15, no. 1(30), pp. 188–208 DOI: https://doi.org/10.15388/omee.2024.15.10
Contrasting the Performance of Active and Passive Unit Trusts under Normal Market Conditions: Is the Experience of Emerging Markets Different?
Thabo J. Gopane (corresponding author)
University of Johannesburg, Department of Finance and Investment Management, South Africa
tjgopane@uj.ac.za
https://orcid.org/0000-0002-4182-7149
Mukundi Ravhura
University of Johannesburg, Department of Finance and Investment Management, South Africa
201306262@student.uj.ac.za
Abstract. The predominant tradition in the literature is to scrutinise the competitive performance of passive and active investment strategies with less regard to the prevailing market climate. The thesis of this paper is that volatile market conditions may necessitate investment strategy adjustments. Such readjustments may confound empirical comparison of passive and active investing if econometric models do not adapt accordingly. Currently, the literature cannot give a stylised fact of whether the historical claims of passive–active relationships relate to normal market conditions or not, which is a flaw. The present study reduces the flagged knowledge gap by answering the question whether passive investment outperforms active investing under normal market conditions. The study applies the parametric and non-parametric risk-adjusted models of the Jensen alpha and Sharpe index. The empirical analysis is based on the weekly returns of 16 unit trusts listed on South Africa’s Johannesburg Stock Exchange for ten years (between 2009 and 2019). Consistent with the hypothesis of inefficient capital markets in developing economies, the study finds that active investing significantly outperforms passive investment strategy under normal market conditions. The results should benefit investors and policymakers in the era of increasing competitiveness, digitalisation, and globalisation.
Keywords: market conditions, passive investing, active investing, portfolio performance, unit trusts
Received: 18/1/2023. Accepted: 27/2/2024
Copyright © 2024 Thabo J. Gopane, Mukundi Ravhura. Published by Vilnius University Press. This is an Open Access article distributed under the terms of the Creative Commons Attribution Licence, which permits unrestricted use, distribution, and reproduction in any medium, provided the original author and source are credited.
1. Introduction
The premise of this paper is that sustained turbulent market conditions may demand strategic investment adaptation to preserve optimal portfolio allocations. The predominant literature tradition is to contrast the performance of passive versus active investing with less regard to the prevailing market conditions except a few that tend to emphasise bear and bull markets (Paramita et al., 2017; Gopane et al., 2023). The objective of the current study is to answer the question: Does passive investing outperform active investing under normal market conditions?
The debate of passive versus active investing has gained momentum since the emergence of the portfolio measure of alpha (Jensen, 1968). It continues to be a topical subject in financial markets with diverse risk implications for investors. Legal practitioners concur (Willis & Chung, 2022, p.13). In a recent UK case (Insurance Group RSA) concerning passive and active investing, the court permitted the claimant (of investor action group) “to adduce expert evidence.” In support of the ruling, Willis and Chung (2022, p.13) assert: “We consider this to be a step in the right direction … in our view [Sections 90 and 90A], should include active investors as well as so-called passive or tracker funds.” Other style-related questions tend to puzzle investment decisions, like whether passive or active investing is a better match for retirement schemes (Gonzalez et al., 2020) and whether passive or active investing enables better compliance with the fiduciary duty of prudence (FDP) for fund managers. The FDP obligation tends to compound litigation risks for fund managers like the memorable U.S. cases concerning passive versus active investing, Bell vs Anthem and Brotherson vs Putnam (reviewed by Harmon and Fisher, 2019).
Asset management or collective investment schemes (CIS) in general (including the South African unit trust sector) is a significant global industry and provides valuable long-term investment opportunities. The first unit trust in South Africa, Sage Fund, was installed in 1965, with USD 32,250 assets under management, and it still exists today. Since then, the South African unit trust sector had achieved USD181 billion in assets under management at the end of September 2023 (ASISA, 2023a).
In principle, fund managers pursue the business objective and fiduciary responsibility of maximising client (investor) returns. To do so, while asset managers may configure various investment strategies, the question always remains: is the portfolio passive, active investing, or something in the middle (like core-satellite) investing? The latter is explained comprehensively elsewhere (Monga et al., 2022), and the current research focuses on passive versus active investment styles.
Passive investing follows a long-term buy-and-hold strategy based on the rationale that the financial markets are efficient enough to discourage stock-picking efforts. Predominantly passive investing aims to mimic the performance of reputable stock market indices, like the S&P500 in the United States, the FTSE100 in the United Kingdom, or the JSE ALSI in South Africa, inter alia. Accordingly, passive investing is also known as an index tracker. The disadvantage of tracking the market benchmark is that when the index falls, passive investors go down with it (like in the dot.com bubble). In contrast, active investing maintains an investment philosophy that it is possible to earn excess profits through market timing and skilled analysis of fundamental value drivers, among others. Accordingly, active investing tends to be more expensive due to the necessary analytical work. Therefore, investors should prefer active investing over passive only if the profits justify the cost, other things equal.
Many studies sustain the debate on the comparative performance of passive and active investing (see Jones & Wermers, 2011; Cremers et al., 2019; Millo et al., 2023). The outcome of such analysis is important as it builds the foundations of stylised facts (generalisation) in the passive–active investment choice. However, there is a common analytical weakness in most of the passive–active literature in that they predominately neglect to account for the prevailing market conditions. A set of studies that are closest to the current study are those that examine portfolio performance in the fund management industry though they do not pursue the passive–active debate (like Kaushik et al., 2010; Bertolis & Hayes, 2014; Malefo et al., 2016). Another weakness is that the literature stream examining market regimes (see Kole & Van Dijk, 2017) and studies on the passive–active debate tend to pursue their investigations on a parallel basis. The problem with disregarding market conditions is that different market climates, such as bear, bull, or normal market conditions, are now assumed to impact both passive and active investing uniformly. The present study contributes towards correcting the literature weakness in three ways.
First, the primary contribution of the study is to examine the question of whether passive investing outperforms active investing under normal market conditions in emerging markets, taking South Africa as a case study. In this regard, normal market conditions are reasonably sustained time intervals when no significant price fluctuations or structural changes emanate from unexpected events like the global financial market crisis, the COVID-19 pandemic, or geopolitical tensions like the Russia–Ukraine wars. Such major market shocks tend to trigger drastic policy responses like central banks implementing extraordinary controls on market liquidity, among others. Second, the study contributes knowledge regarding investment styles in emerging markets. Third, the study contributes knowledge regarding financial market efficiency in emerging markets. The rest of the paper is organised as follows: Section 2 presents a literature review of the passive–active debate, Section 3 discusses the methodology employed for comparative performance analysis, Section 4 presents the results and discussion, and Section 5 concludes the study.
2. Literature Review
The performance of active and passive portfolio management remains an area of interest among academics and financial practitioners with potential spillovers in non-bank financial intermediation (Chari, 2023) and general macroeconomy (Schroth, 2021). In emerging markets like South Africa, there has been reasonable growth in fund management research but less so in the sub-theme of investment strategies. This section outlines the theoretical background underpinning the passive–active investing debate and then scans the prevailing empirical studies. The theoretical framework includes the efficient market hypothesis, which supports passive investing, and behavioural finance, which provides some rationale behind the active investment strategy.
2.1 Efficient Market Hypothesis and Investment Strategies
The efficient market hypothesis (EMH) is a theory spearheaded by Eugen Fama, a Nobel laureate in economics science (Fama, 1969, 1970, 1991, 1998). The theory is framed on the premise that in an efficient market, investors should not be able to consistently make abnormal returns above equilibrium market returns. The thinking is that security prices should fully reflect all available information timeously. In this regard, the scope of EMH encapsulates past trading information (called the weak form), the firm’s financial and/or macroeconomic information (semi-strong), as well as private information (the strong form). Additionally, EMH assumes that investors are rational value optimisers who exhibit risk-minimising and return-maximising behaviours.
Further, EMH expects security markets to maintain equilibriums with immediate price adjustments in response to new information. Consequently, EMH is consistent with an investment strategy of buy and hold, or index tracking, known as the passive investing style. However, over the years, EMH was subjected to intensive empirical scrutiny, which questioned its robustness in explaining the observed failures in some of its predictions, the EMH anomalies, like post-earning-announcement drift. An extensive population of anomalies is reviewed comprehensively elsewhere (Goodell et al., 2023). Actually, the rise of EMH anomalies compounded doubts about EMH realities, leading to an increase in market timing or stock-picking activities, meaning an active investing style. An effort to explain the anomaly puzzles paved the way for the emergence of competing alternative EMH theories.
2.2 Behavioural Finance and Investment Strategies
The emergence of Behavioural Finance theory (BFT) is anchored on the works of cognitive psychologists (Kahneman & Tversky, 1972, 1973, 1979) but evangelised in the finance discipline by Thaler (1999) with prominent backup from other proponents (Shiller, 2003) responding to the puzzles of EMH anomalies. According to BFT, what is seen as an anomaly is actually the reality of the investors’ decision-making process, which is influenced by natural human biases and psychological factors like conservatism, decision framing, mental accounting, and regret avoidance, to mention a few. BFT and active investing are correlated. For instance, active investors may decide to adopt contrarian or momentum strategies with a view that the markets often overshoot or underreact in response to new information. Unlike EMH, in the BFT world, the rationality assumption is relaxed, and the aforesaid investment choices are deemed normal investment practice.
2.3 Other EMH Alternatives and Investment Strategies
While EMH and BFT are two polar perspectives to explain investor behaviour, several hypotheses and extensions exist between them. What seems to reconcile EMH Alternatives (EMH-A) is their cordiality to accept that financial markets possess some level of efficiency, leading to trading possibilities of hard-to-get but achievable abnormal profits. More importantly, since EMH-A relax some of EMH assumptions, they pursue the goal of justifying EMH anomalies and implicitly explaining (in part) the presence of active investing. For example, the Fractal Market Hypothesis by Peters (1994) says that investors are fractal (differ) according to their preferred investment horizons such that, in contrast to EMH, market patterns like trends, reversals, and volatility clustering are normal, which is consistent with active investment strategy. Next, the Adaptive Market Hypothesis by Lo (2004) says that investors learn from past experiences and adapt to changing market conditions. Although the EMH-A tend to predict active investing more than passive, they also recognise that abnormal profits are not easy to find, and there are constraints like limits to arbitrage. Numerous other EMH alternatives are explained systematically elsewhere (Nyakurukwa & Seetharam, 2023).
2.4 Global Empirical Evidence
In recent times, financial markets have observed a rejuvenated rise in passive investing globally, especially in developed countries (Chari, 2023). This trend is consistent with the view that active investing does not outperform passive investing due to its expensiveness and limitations in finding skilled managers (see Millo et al., 2023). For a while, Sharpe (1991) argued influentially that active investing is a hopeless zero-sum game where profits of winners and losers aggregate to zero. The literature has shown that the proposition is not watertight enough to survive critical confrontation (Warren, 2020) and is inconsistent with empirical findings (Berk & Van Binsbergen, 2016), which show that aggregate fund managers in the top CIS market of the U.S experience an above-benchmark gross-value-add that is greater than zero. With the Sharpe (1991) proposition neutralised, the research on the passive–active debate continues unhindered.
Baltussen et al. (2022) examined a large universe of European cross-border funds for 13 years (2008 to 2020) domiciled in Ireland and Luxembourg and found no active outperformance, contradicting Dong and Doukas (2020), who looked at non-cross-border European funds and found favourable results for active investing. Gehringer and Lehmann (2023) reconsidered a sample of 200 large established fixed-income funds across Europe with a total value of EUR 900 million for ten years (2010 to 2020) and found favourable results for active investing. Based on these extensive European studies, one can observe a pattern of inconsistent results for and against active investing. Regarding a worldwide study, Leippold and Rueegg (2020) utilised the entire Morning Star CIS database, of the global fund management industry, including the top two CIS locations, Europe and North America. They analysed 60,000 portfolios with a total asset under management of USD17.8 trillion for passive and active investing over 26 years (1991 to 2016) and found unfavourable results for active investing. Therefore, global CIS evidence seems to suggest that active investing fails to perform to its promise and cannot justify the expensive fees. However, the above observations are not as watertight as they seem since they have been challenged on several grounds. First, some passive funds are closet active investing and if discounted, active outperformance may emerge (Cremers & Petajisto, 2009).
Second, some performance measures may have inherent flaws. For instance, Berk and Van Binsbergen (2015, 2016) used a method that looks at aggregate markets (not per fund) and found favourable results for active investing. Third, the old information paradox is still applicable in that, for passive investing to exist, market efficiency is necessary, and the markets become efficient through active investing. This means passive investing is free riding (Leippold & Rueegg, 2020) on active investors’ hard labour (Cremers et al., 2019; Buehlmaier & Wong, 2020). However, economic intuition allows for contradictory results in emerging markets, as evidenced by Dyck et al. (2013) and Abdullah and Shari (2019). Warren (2020) lists several reasons why the developed markets’ lessons of active-investing underperformance may not be a globally generalisable finding. Exceptions include locations where markets are less competitive and inefficient, like emerging markets.
2.5 Emerging Markets and the South African Experience
In South Africa, papers that are closest to the current study are Bertolis and Hayes (2014), Malefo et al. (2016), and Kunjal et al. (2021), who account for economic conditions in their examination of whether fund managers outperform the benchmark. Bertolis and Hayes (2014) examined sub-samples according to the economic states of the downturn, average growth, and robust expansion and found positive results during economic expansion and inconclusive in the rest. Malefo et al. (2016, p. 188) separated sub-samples according to before and after market crises (global financial crisis, along with European debt crisis) and found that: “majority of the unit trust managers show good performance before the crisis, with subsequent inferiority in … turbulent times”. Kunjal et al. (2021) examined the performance of passively managed funds (tracking ability) in South Africa during bear and bull market regimes and found positive results during the bull but not during the bear cycle. These studies are helpful to establish whether it is necessary to account for market conditions in portfolio performance assessment. However, they are not answering exactly the same question as the current study in that they do not set out to contrast the performance of passive and active investing, but they are suggestive.
There is a compelling case for why the performance of passive and active investing in developing markets may yield contradictory results to developed economies. Information theory (Gârleanu & Pedersen, 2018, 2022) and EMH (Fama, 1991, 1998) predict that abnormal profits are more likely if the financial markets are inefficient, making it more conducive for active investing. Cross-country research (Dos Santos et al., 2023; De Abreu et al., 2023) and special case studies (Reddy & Dhabolkar, 2020) show that emerging markets are generally inefficient. Several studies report an unambiguous outperformance of active investing over the passive style including evidence from 137 funds from 22 emerging markets (Huij & Post, 2011) and others (Dyck et al., 2013; Abdullah & Shari, 2019). Regarding the African markets, a 30-year literature review (Adeabah et al., 2023) shows that many African stock markets are inefficient, while South Africa is only weak-form efficient. An empirical question that arises is how the limited market efficiency in South Africa should impact the passive-active investing relationship. An empirical conjecture follows.
Primary Hypothesis (H1): Passive investing outperforms active investment strategies in the South African unit trust sector under normal market conditions.
Technology innovation, digitalisation, increased globalisation, and market integration tend to improve information access and benefit market efficiency which may benefit both passive and active investment strategies (Lisauskiene & Darskuviene, 2021). On the other hand, the extent of market segmentation (Warren, 2020) coupled with semi-form inefficiency may advantage active investing like other emerging markets. For instance, after studying 20 emerging stock markets Butt et al. (2022, p. 502) conclude that “emerging stock markets still offer ample opportunities for both global and local investors towards active investment strategies.”
Secondary Hypothesis (H2): Passive investing has equal performance to the benchmark in the South African unit trust sector under normal market conditions.
Another Secondary Hypothesis (H3): Active investing outperforms the benchmark in the South African unit trust sector under normal market conditions.
Based on the continued exponential growth of the South African CIS market, it is rational to expect fund managers to be competitive enough to equal or outperform the benchmark on average, especially in emerging markets, and this happens to be their business objective in line with H2 and H3. However, the extent of fund managers’ success (if they achieve it) is an empirical question.
3. Methodology
3.1 Model Motivation
Pedersen and Rudholm-Alfvin (2003) maintain that the best practice performance metric should satisfy three conditions: appropriateness in capturing the fundamental features of the return distribution, foundation in its ability to be supported by economic theory, and finally, clarity in its interpretation in simple terms. In our view, Jensen’s alpha (Jensen, 1968) fits the recommended standard. Along with its established theory of capital asset pricing model (CAPM), it is also convenient for past studies-comparability (see Cremers et al. 2019). Nevertheless, we also apply the Sharpe index (Sharpe, 1966) as an alternative cross-checking method.
3.1.1 Absolute Performance Measure: Jensen’s Alpha. Jensen’s alpha measures the excess returns of a portfolio over and above the market benchmark return. In this model, a higher and positive alpha metric indicates a superior portfolio performance. Jensen’s alpha (αρ) is explained in Equation (1).
 (1)
(1)
In Equation (1), the variable R is return, and the subscripts p, m, and f identify portfolio, market index, and risk-free rate, respectively. The beta (β) is the systematic risk quantified through Equation (2). The bar on top of the variables signifies unconditional means. To interpret Equation (1), when the portfolio alpha is positive, then the unit trust is said to have performed better than the market benchmark. A zero indicates neutral performance, while a negative alpha denotes the unit trust’s underperformance of the market benchmark. To evaluate the portfolio beta, we regress the portfolio excess return (Rpt – Rft) against the market excess return (Rmt – Rft)  in Equation (2). The last term, ept is the regression error.
 (2)
(2)
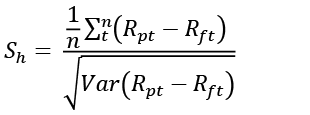
3.1.2 Relative Performance Measure: the Sharpe Index. While profiling critical families of portfolio performance measures (PM), Caporin et al. (2014, p. 936) recall that “conventional wisdom tells us a … ‘good’ PM must be persistent over time”, and that “Sharpe (1966) ratio is still considered as the reference PM”. The original Sharpe index is computed as a ratio of the portfolio’s excess return to its standard deviation,  . An upgrade on the original formula (Sharpe, 1994) is to allow the difference in the numerator to vary and to account for the variability of this excess return. Precisely, the improved framework is presented in Equation (3), and it is applied in the current study. Although in this paper we maintain the original Sharpe theme of computing excess return over the risk-free rate, Rft, the new Sharpe measure permits researchers to specify alternative benchmarks as appropriate (like Sharpe, 1992). The advantage of Equation (3) is that it has a convenient test statistic by multiplying the Sharpe ratio with the square root of total observations (n) used in the study (that is, Statistic =
  A portfolio manager prefers a large and positive Sharpe ratio as it indicates that the return on the portfolio compensates for the risk taken. Equation (3) computes the ex-post (or historical) Sharpe index (Sh). The numerator quantifies the mean of portfolio excess return, while the denominator calculates its standard deviation. The rest of the variables are as previously defined.
 (3)
(3)
3.2 Data Collection and Sample Selection
The JSE Allshare Index (ALSI) is a proxy for fund performance benchmark, and the All Bond Index (ALBI) is a proxy for risk-free rates and is sourced from the online Iress database (Iress, 2023). The study sample (of passive and active funds) is obtained from the South African CIS database maintained and published by the Association for Savings and Investment South Africa (ASISA), available online (ASISA, 2023b). The extracted funds are subjected to a specific selection criterion. First, global portfolios were omitted from the sample because this study focuses on the South African market. Second, portfolios with missing or partial data are unusable and excluded. Third, funds of funds were disregarded to prevent double counting. Fourth, all unit trusts included in the sample come from the same database for consistency. Lastly, for inclusion, the fund must have existed for the entire study period.
The criteria of identifying which funds are passively or actively managed entailed an elaborate screening of the fund fact sheets. Actively managed portfolios are free trading funds, while passively managed portfolios are index trackers. To improve comparability, only general equity funds were considered. This means that passive funds track equity indices. After satisfying all selection criteria, the final sample consisted of 16 portfolios (listed in Table 1), eight from each group and within November 6, 2009 to November 29, 2019, resulting in 530 weekly observations. The sample begins after the global financial crisis of 2007 to 2008 and is constrained to the end of November 2019 (before the Covid19 pandemic) to exclude market turbulences induced by financial market crises.
3.3 Descriptive Summary Statistics
Table 1
Sample of the South African Unit Trust Funds
|
Passive Investing |
Active Investing |
||
|
Unit trust name |
Code |
Unit Trusts Name |
Code |
|
Old Mutual Rafi 40 Index Fund A (OMUA) |
PP1 |
PPS Equity Fund Class A (PPSE) |
PA1 |
|
NewFunds S&P Givi SA T50 (GIVISA) |
PP2 |
Sim General Equity Fund R (SNTR) |
PA2 |
|
Satrix Rafi 40 Portfolio (STXRAF) |
PP3 |
Allan Gray Equity Fund Class A (AGEF) |
PA3 |
|
Gryphon AllShare A (PTST) |
PP4 |
Oasis General Equity Fund (OGEN) |
PA4 |
|
FNB Top 40 ETF (FNBT40) |
PP5 |
PSG Equity Fund A (PSGG) |
PA5 |
|
1Nvest ALSI 40 fund - A (LBFT) |
PP6 |
Coronation Equity Fund A (CORA) |
PA6 |
|
Prescient Core Top 40 Equity Fund- A1 (PEQF) |
PP7 |
M&G Equity B (PEFB) |
PA7 |
|
Satrix AlSI Index Fund A1 (SAAIF) |
PP8 |
Discovery Equity Fund (DIEF) |
PA8 |
Note. This table provides a list of fund names and codes used in this study. Source: The Association for Savings and Investment South Africa (ASISA, 2023b).
Equation (4) generates the log returns used in Equations 1 to 3 summarised in Tables 2 and 3. The variable t is an index of time in weeks while Pt and Pt–1 are current and one-period lagged closing prices. Equation (4) computes weekly returns, r ∈ {Rp, Rm, Rf } as follows:
rt = ln(Pt) – ln(Pt-1) (4)
Table 2
Summary Descriptive Statistics for the Passively Managed Funds
|
Statistics |
PP1 |
PP2 |
PP3 |
PP4 |
PP5 |
PP6 |
PP7 |
PP8 |
Ave |
ALSI |
|
Mean |
0.002 |
0.003 |
0.003 |
0.003 |
0.003 |
0.002 |
0.003 |
0.002 |
0.003 |
0.003 |
|
Maximum |
0.004 |
0.045 |
0.004 |
0.004 |
0.003 |
0.005 |
0.005 |
0.004 |
0.004 |
0.039 |
|
Minimum |
-0.048 |
-0.044 |
-0.045 |
-0.042 |
-0.038 |
-0.050 |
-0.070 |
-0.048 |
-0.046 |
-0.036 |
|
Std. Dev. |
0.016 |
0.018 |
0.016 |
0.015 |
0.017 |
0.017 |
0.018 |
0.016 |
0.016 |
0.015 |
|
Skewness |
-0.317 |
-0.134 |
-0.238 |
-0.489 |
-0.171 |
-0.468 |
-0.638 |
-0.317 |
-0.369 |
-0.242 |
|
Kurtosis |
3.184 |
3.046 |
2.875 |
3.243 |
2.882 |
3.206 |
4.034 |
3.184 |
3.149 |
2.921 |
|
JB Test |
2.720 |
0.464 |
1.519 |
6.353 |
0.818 |
5.741 |
16.855 |
2.720 |
3.536 |
1.497 |
|
Probability |
0.257 |
0.793 |
0.468 |
0.042 |
0.664 |
0.057 |
0.000 |
0.257 |
0.171 |
0.473 |
|
*** |
*** |
*** |
** |
*** |
* |
*** |
*** |
*** |
*** |
|
|
PP Stat |
-12.67 |
-14.39 |
-12.96 |
-12.46 |
-12.08 |
-12.77 |
-13.21 |
-12.67 |
-12.53 |
-12.52 |
|
ADF Stat |
-12.67 |
-14.39 |
-12.96 |
-12.46 |
-12.08 |
-12.77 |
-13.21 |
-12.67 |
-12.12 |
-12.41 |
|
Observations |
150 |
150 |
150 |
150 |
150 |
150 |
150 |
150 |
150 |
150 |
Note. ALSI= JSE All Share Index. Ave = average. Fund codes (PP1, …, PP8) are defined in Table 1. For the Jarque-Bera (JB) test, statistical significance, ***1%, **5%, *10%, show satisfactory normal distribution for all series. Both ADF (augmented Dickey-Fuller ) and PP (Phillips–Perron) unit root tests confirm the stationarity of all series using MacKinnon (1996) one-sided p-values. Source: Authors’ computations.
Tables 2 and 3 present the actual descriptive summary statistics of passive and active funds, respectively. Table 2 shows that all portfolios are relatively comparable with each other, with means ranging from 0.2% to 0.3% (same level as ALSI) except for two funds, which seem to have unique performance patterns. PP2 (Sim General Equity) stands out with the highest upper bound of 4.5%, while the rest have an average maximum of 0.4%. Along with PP7 (M&G Equity B), the two funds have the same mean as the benchmark but are more volatile, bouncing deeper in the negative and with the highest standard deviation of 1.8% compared with the average of 1.6%. On aggregate, passive funds have similar unconditional mean returns but are riskier than the benchmark.
Table 3
Summary Descriptive Statistics for the Actively Managed Funds
|
PA1 |
PA2 |
PA3 |
PA4 |
PA5 |
PA6 |
PA7 |
PA8 |
Ave |
ALSI |
|
|
Mean |
0.003 |
0.003 |
0.003 |
0.003 |
0.004 |
0.003 |
0.003 |
0.001 |
0.003 |
0.003 |
|
Maximum |
0.034 |
0.033 |
0.034 |
0.031 |
0.034 |
0.042 |
0.034 |
0.042 |
0.030 |
0.039 |
|
Minimum |
-0.042 |
-0.039 |
-0.036 |
-0.034 |
-0.030 |
-0.046 |
-0.037 |
-0.043 |
-0.036 |
-0.036 |
|
Std. Dev. |
0.014 |
0.013 |
0.014 |
0.013 |
0.012 |
0.015 |
0.014 |
0.014 |
0.013 |
0.015 |
|
Skewness |
-0.554 |
-0.327 |
-0.311 |
-0.457 |
-0.037 |
-0.459 |
-0.442 |
-0.260 |
-0.441 |
-0.242 |
|
Kurtosis |
3.268 |
3.164 |
3.378 |
3.220 |
3.034 |
3.679 |
3.404 |
3.473 |
3.299 |
2.921 |
|
JB Test |
8.117 |
2.847 |
3.306 |
5.512 |
0.041 |
8.149 |
5.914 |
3.088 |
5.419 |
1.497 |
|
Probability |
0.017 |
0.241 |
0.191 |
0.064 |
0.980 |
0.017 |
0.052 |
0.214 |
0.067 |
0.473 |
|
** |
*** |
*** |
* |
*** |
** |
** |
*** |
* |
*** |
|
|
PP Stat |
-12.86 |
-12.51 |
-12.27 |
-12.49 |
-11.98 |
-12.93 |
-12.83 |
-13.01 |
-12.42 |
-12.52 |
|
ADF Stat |
-12.87 |
-12.52 |
-12.27 |
-12.49 |
-11.87 |
-12.93 |
-12.84 |
-12.98 |
-12.53 |
-12.41 |
|
Observations |
150 |
150 |
150 |
150 |
150 |
150 |
150 |
150 |
150 |
150 |
Note. See Table 2 for the definition of codes. Source: Authors’ computations.
Regarding actively managed funds, Table 3 shows that while the ALSI has a modest upper bound of 3.9%, they both have the same average of 0.3% and a similar lower bound of –3.6%. With an average standard deviation of 1.3%, the ALSI is moderately more volatile at 1.5%. Overall, PA8 (Discovery equity) is the only portfolio that deviates from others with lower average return and higher standard deviation. Nevertheless, both passive (Table 2) and active investing (Table 3) have relatively comparable summary descriptive statistics close to the benchmark, but passive funds have a slightly higher standard deviation, more than the benchmark by 0.1%. All returns are moderately left-skewed (negative skewness), and the sample peakedness is reasonably mesokurtic (Kurtosis close to three), consistent with the satisfactory normality results of the Jarque-Bera test. Both samples are stationery based on Phillips Perron (PP) as well as the augmented Dickey-Fuller (ADF) unit root tests and have a satisfactory normal distribution (Jarque-Bera test).
3.4 Pre-Modelling Validation
The study’s primary research question is to establish whether passive investing outperforms active investing under normal market conditions. Before estimating Equations (1) to (3) it is important to apply appropriate pre-estimation validation tests. First, to select a valid econometric model for Equation (2), we apply the structural break test (for details see Perron, 2006) and BDS linearity test (Brock et al., 1996) using the entire sample size of 530 observations. Both tests failed, implying that the chosen sample period is not uniformly stable and that a valid estimation procedure for Equation (2) is a nonlinear regression model. Consequently, we adapt the quantile regression model (QRM) to estimate Equation (2), focusing on a quantile of 50% in line with the research objective of evaluating passive–active investing under normal market conditions. This model selection procedure is consistent with Ozcelebi and Izgi (2023).
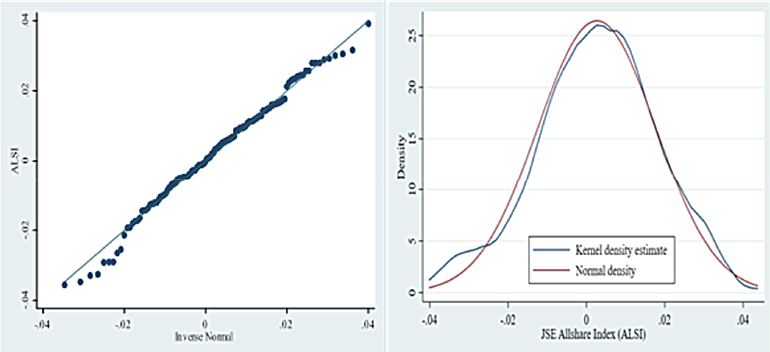
Second, for the purpose of estimating Equation (3), we need to select a sub-period with the calmest market climate. To assist in identifying such a time horizon, we use the structural break test (with unknown dates). Accepting the test’s stipulated dates along with graphical inspection, we settle for the normal market condition period of 9 December 2011 and 3 October 2014, resulting in 150 observations or a trading period of three years. The often disregarded analytical property is that the Sharpe Index provides reliable results if the standard deviation is computed from a normal distribution (Lo, 2002) with no serial correlation. The tests of structural break (Table A1, Figure A1), normality (Table 2, Table 3, Figure A2), and linearity (Table A2) are satisfied, validating the application of Equation (3).
4. Results and Discussion
4.1 Empirical results
Table 4 presents the results for Jensen’s alpha (Equation 1) and the Sharpe index (Equation 3). While the first five columns provide calculation inputs, the core results are reported in the last three columns and are annualised. All the results are strongly significant at less than one percent level. Beta is a measure of volatility or systematic risk of a portfolio in relation to the market index. A portfolio with a beta less than one is less volatile, while a beta greater than one indicates that a portfolio is more volatile than the benchmark. Panel A (passive funds) shows that the betas are positive, with an average of 1.02 approximating an expected one-to-one co-movement with the benchmark, as index trackers. In contrast, Panel B (active funds) shows an average beta of 0.83, as anticipated, indicating a strong correlation but asynchronous association with the benchmark, reflective of active portfolio management.
Panel A shows that almost all alphas are less than zero with an average of negative one percent. Accordingly, we reject H2, and conclude that passive funds neither outperform nor equal the benchmark. We have noted that while the passive funds co-move with the market, they are riskier (with a higher standard deviation than the index). Also, since they are more volatile than the index they have beta greater than one. Each time the market goes down, they deepen lower than the market to a minimum lower bounce of -4.6% compared to the benchmark of -3.6 (see Table 2). A little puzzle is that they fail to swing higher than the market (with a maximum of 0.4% compared to the large ALSI upper bound of 3.9%) in good times. Nevertheless, this probably reflects funds’ indexation configuration and/or inadvertent tracking error. Kunjal et al. (2021) find that the South African passive funds (exchange-traded funds) have higher tracking errors in bear markets compared to bullish market conditions.
In contrast to the negative alpha performance of passive funds, Panel B shows that only one fund, PA8 (Discovery equity), has a negative alpha, while the rest are greater than zero with an average of 3.4%. Therefore, we fail to reject H3 and conclude that actively managed funds outperform the benchmark. Passive and active funds have an average Sharpe ratio of 0.6 and 0.8, respectively, indicative of active investing outperformance. Figures 1 and 2 provide a further intuitive comparative explanation.
Table 4
Results of Jensen’s Alpha and the Sharpe Index
|
Fund |
Beta |
β(Pvalue) |
μ(Rp – Rf) |
σ(Rp-Rf) |
Jensen |
Sharpe |
Sharpe |
|
Panel A: Passively Managed Fund |
|||||||
|
PP1 |
1.01 |
0.000*** |
0.110 |
0.209 |
-0.027 |
0.52 |
6.43*** |
|
PP2 |
1.04 |
0.000*** |
0.132 |
0.228 |
-0.009 |
0.58 |
7.11*** |
|
PP3 |
0.99 |
0.000*** |
0.141 |
0.209 |
0.007 |
0.67 |
8.25*** |
|
PP4 |
0.97 |
0.000*** |
0.141 |
0.189 |
0.009 |
0.74 |
9.12*** |
|
PP5 |
1.06 |
0.000*** |
0.134 |
0.212 |
-0.010 |
0.63 |
7.77*** |
|
PP6 |
1.04 |
0.000*** |
0.125 |
0.220 |
-0.016 |
0.57 |
6.99*** |
|
PP7 |
1.05 |
0.000*** |
0.128 |
0.226 |
-0.015 |
0.57 |
6.94*** |
|
PP8 |
1.01 |
0.000*** |
0.110 |
0.209 |
-0.027 |
0.52 |
6.43*** |
|
Ave |
1.02 |
0.000*** |
0.128 |
0.213 |
-0.011 |
0.60 |
7.38*** |
|
Panel B: Actively Managed Funds |
|||||||
|
PA1 |
0.93 |
0.000*** |
0.142 |
0.190 |
0.015 |
0.74 |
9.12*** |
|
PA2 |
0.87 |
0.000*** |
0.159 |
0.177 |
0.041 |
0.90 |
10.98*** |
|
PA3 |
0.80 |
0.000*** |
0.152 |
0.179 |
0.043 |
0.84 |
10.34*** |
|
PA4 |
0.78 |
0.000*** |
0.134 |
0.171 |
0.028 |
0.78 |
9.60*** |
|
PA5 |
0.79 |
0.000*** |
0.193 |
0.175 |
0.090 |
1.11 |
13.55*** |
|
PA6 |
0.87 |
0.000*** |
0.169 |
0.198 |
0.051 |
0.85 |
10.45*** |
|
PA7 |
0.86 |
0.000*** |
0.172 |
0.181 |
0.057 |
0.95 |
11.64*** |
|
PA8 |
0.76 |
0.000*** |
0.046 |
0.193 |
-0.056 |
0.24 |
2.89*** |
|
Ave |
0.83 |
0.000*** |
0.146 |
0.183 |
0.034 |
0.80 |
9.82*** |
Note. Fund codes are explained in Table 1. Betas are computed from Equation (2) estimated with the quantile regression model, and the Sharpe Index is computed from Equation (3) using a sub-sample of 150 weeks selected through structural break test with unknown dates. *** Statistically significant at 1% level. Ave = Average. μ(Rp – Rf) and σ(Rp – Rf) = mean and standard deviation of portfolio’s excess returns, respectively. Source: Authors’ computation.
To elaborate further, we use Table 4 to provide graphical rankings of Jensen’s alphas (Figure 1) and Sharpe ratios (Figure 2). Both Figures are presented uniformly, where the horizontal axis gives the portfolio ranking from 1 to 9 (8 funds plus averages), while the vertical axis records the performance metric. For example, in each Figure, funds in the top right corner (of the Cartesian plane) outperform the set of funds in the bottom left corner. With the exception of PA8 (Discovery), the graph-based comparison shows that the actively managed funds are consistently ranked higher (solid line) than passive (dotted line) in terms of Jensen’s alphas (Figure 1) and Sharpe ratios (Figure 2). Therefore, we reject H1 and confirm that actively managed funds outperform passive funds. Further, Figure 1 shows that 75% of the index trackers (dotted line) are submerged below the zero line confirming underperformance of the ALSI benchmark and the rejection of H2.
Figure 1
A Plot of Jensen’s Alphas for Passive and Active Portfolios
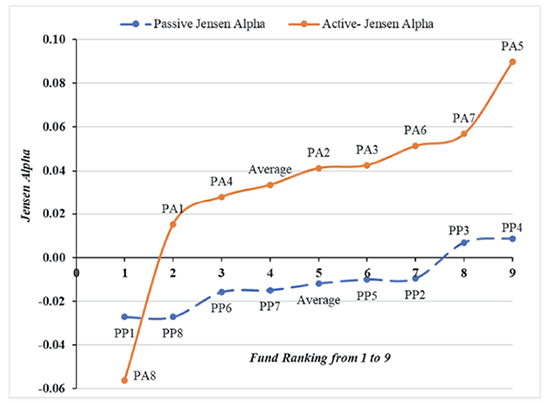
Note: The graphs present the South African Unit Trusts’ performance under normal market conditions based on the Jensen measure. The solid line shows active funds, and the dotted line displays passive funds. Source: Authors’ graphics.
Figure 2
A Plot of the Sharpe Index for Passive and Active Portfolios
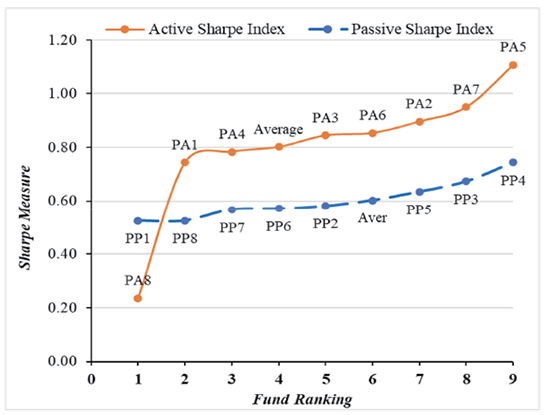
Note. The graphs present the South African Unit Trusts’ performance under normal market conditions based on the Sharpe index. The solid line shows active funds, and the dotted line displays passive funds.
4.2 Discussion
The primary research question of this study is whether passive investment outperforms active investment strategy under normal market conditions in emerging markets (South Africa). Our results show that under such a calm trading climate, actively managed funds outperform passive portfolios. These results are in tandem with some experience from other emerging economies like single country research of Malaysia (Abdullah & Shari, 2019), a cross-country investigation of 22 emerging markets (Huij & Post, 2011), and a study of global emerging markets in the CEM Benchmarking database (Dyck et al., 2013). The results are consistent with the South African literature stream that focuses on a similar research question (in part) of whether active investing outperforms passive and/or investment benchmarks (Meyer-Pretorius & Wolmarans, 2006; Hirschel & Krige, 2010; Kalima & Gopane, 2022), irrespective of the prevailing market environment. However, other articles in South Africa have observed contrary outcomes (Tan, 2015; Coetzee et al., 2018; Toerien et al., 2022) or mixed results (Fox & Krige, 2013).
Most prior studies have a common unexplained methodological approach of not accounting for market conditions, resulting in some implicit assumptions: that the chosen sample is a reasonable random approximation of reality or bear, and bull market swings aggregate out within the chosen study periods. Our view is that unless the assumption is econometrically confirmed, then it ought to be relaxed. A few local papers that control for economic conditions of business cycles (Bertolis & Hayes, 2014), financial crises (Malefo et al., 2016), and market regimes (Kunjal et al., 2021) are similar to the current study by evaluating the performance of unit trust against the market benchmark but differ because they do not explicitly contrast passive and active investing. The general message from these studies is that unit trust managers outperform benchmark during good economic times, underperform in recessions, and yield mixed or inconclusive results during normal economic times, whereas the reverse tends to manifest in developed countries (Kaushik et al., 2010). Although we differ in findings from the last set of local studies, there is an agreement that accounting for market conditions has important empirical and practical implications.
5. Conclusion
This study examined the performance of passive and active unit trusts in the emerging market of South Africa under normal market conditions using the risk-adjusted measures of Jensen’s alpha and the Sharpe index. Two insightful observations emerge from the study. First, passive funds underperform the benchmark. Although the explanation of why under- or overperformance exceeds the scope of this study, we offer some intuition as the numbers talk. The passive funds co-move with the benchmark but oscillate deeper (than the market) into negative zones with only mild upside swings. This could be due to indexing configuration or straight tracking error, among other things. Second, the results show that active funds outperform both the benchmark and passive portfolios. Further research is recommended to use evaluation measures that account for asymmetric (downside and upside) returns performance. The current study adds value to the topical debate of passive–active investing and other related disciplines like the economics of tort. For example, in finance litigations regarding trust issues of fiduciary duty of prudence in asset management, a full awareness of passive–active contrasts is necessary, including whether the applicable stylised facts apply to normal market conditions or not. There is value in an exclusive focus on general equity funds (like the current study), but the drawback is a restricted sample size. Future research can overcome the limitation by more appropriate econometric modelling.
References
Abdullah, N. A. H., & Shari, A. (2019). A Comparative Analysis of Fixed Income Unit Trust Funds versus Equity Unit Trust Funds in Malaysia. Asian Academy of Management Journal of Accounting and Finance, 15(2), 95–117.
Adeabah, D., Abakah, E. J. A., Tiwari, A. K., Hammoudeh, S. (2023). How far have we come, and where should we go after 30+ years of research on Africa’s emerging financial markets? A systematic review and a bibliometric network analysis. Emerging Markets Review, 55(101030), 1–30.
ASISA. (2023a, November 14). Cautious CIS investors look for diversification in multi-asset portfolios [Media release]. www.asisa.org.za/media-release.
ASISA. (2023b). Dataset, local fund statistics. www.asisa.org.za/statistics.
Baltussen, G., Beckers, S., Hazenberg, J.J., & Van Der Scheer, W. (2022) Fund Selection: Sense and Sensibility. Financial Analysts Journal, 78(3), 30–48.
Berk, J., & Van Binsbergen, J. (2015). Measuring skill in the mutual fund industry. Journal of Financial Economics, 118(1), 1–20.
Berk, J. B., & van Binsbergen, J. H. (2016). Active Managers are Skilled: On Average, They Add More than $3 Million per Year. Journal of Portfolio Management, 42, 131–139.
Bertolis, D. E., & Hayes, M. (2014). An investigation into South African general equity unit trust performance during different economic periods. South African Actuarial Journal, 14(1, 73–99.
Brock, W. A., Scheinkman, J. A., Dechert, W. D, & LeBaron, B. (1996). A test for independence based on the correlation dimension. Econometric Reviews, 15(3), 197–235.
Buehlmaier, M. M., & Wong, K. P. (2020). Should Investors Join the Index Revolution? Evidence from Around the World. Journal of Asset Management, 21, 192–218.
Butt, H. A., Demirer, R., Sadaqat, M., & Suleman, M. T. (2022). Do emerging stock markets offer an illiquidity premium for local or global investors? Quarterly Review of Economics and Finance, 86, 502–515.
Caporin, A., Jannin, G. M., Lisi, F., & Maillet, B. B. (2014). A Survey on the Four Families of Performance Measures. Journal of Economic Surveys, 28(5), 917–942.
Chari, A. (2023). Global Risk, Non-Bank Financial Intermediation, and Emerging Market Vulnerabilities. Annual Review of Economics, 15, 549–572.
Coetzee, R., De Villiers, J., & Nel, D. (2018). Active share, tracking error, and the cost of active management: South African general equity unit trusts. Management Dynamics: Journal of the Southern African Institute for Management Scientists, 27(3), 2–13.
Cremers, K.M., Fulkerson, J. A., & Riley, T.B. (2019). Challenging the Conventional Wisdom on Active Management: A Review of the Past 20 years of Academic Literature on Actively Managed Mutual Funds. Financial Analysts Journal, 75(4), 8–35.
Cremers, K. M., & Petajisto, A. (2009). How Active is Your Fund Manager? A New Measure that Predicts Performance. Review of Financial Studies, 22(9), 3329–3365.
De Abreu, D. P. A., De Camargos, M. A., & Bressan, A. A. (2023). The (In)Efficiency of Emerging and Developed Markets: An Analysis from Fractal Theory. Brazilian Administration Review, 20(1), 1–16.
Dong, F., & Doukas J. A. (2020). Did Fund Managers Deliver Value During the Financial crisis? Journal of Wealth Management, 23(1), 47–59.
Dos Santos, M. A., Fávero, L. P. L., & Brugni, T. V. & Serra, R. G. (2023). Adaptive markets hypothesis and economic-institutional environment: A cross-country analysis. Revista de Gestão, forthcoming.
Dyck, A., Lins, K. V., & Pomorski, L. (2013). Does Active Management Pay? New International Evidence. Review of Asset Pricing Studies, 3(2), 200–228.
Fama, E. F., Fisher, L., Jensen, M. C., & Roll, R. (1969). The Adjustment of Stock Prices to New Information. International Economic Review, 10(1), 1–21.
Fama, E. F. (1970). Efficient Capital Markets: A Review of Theory and Empirical Work. Journal of Finance, 25(2), 383–417.
Fama, E. F. (1991). Efficient Capital Markets II. The Journal of Finance, 46(5), 1575–1617.
Fama, E .F. (1998). Market efficiency, long-term returns, and behavioral finance. Journal of Financial Economics, 49(3), 283–306.
Fox, M. A., & Krige, J. D. (2013). Investigating the sources of performance in South African general equity unit trusts. Investment Analysts Journal, 42(77), 45–54.
Gârleanu, N., & Pedersen, L. H. (2022). Active and Passive Investing: Understanding Samuelson’s Dictum. Review of Asset Pricing Studies, 12(2), 389–446.
Gârleanu, N., & Pedersen, L. H. (2018). Efficiently Inefficient Markets for Assets and Asset Management. Journal of Finance, 73(4), 1663–1712.
Gehringer, A., & Lehmann, K. (2023). Active versus Passive: In the Bond Universe. Journal of Beta Investment Strategies, 14(2), 61–74.
Gonzalez, T. A., van Lelyveld, I., & Lučivjanská, K. (2020). Pension fund equity performance: Patience, activity or both? Journal of Banking and Finance, 115(105812), 1–16.
Goodell, J. W., Kumar, S., Rao, P., & Verma, S. (2023). Emotions and stock market anomalies: A systematic review. Journal of Behavioral and Experimental Finance, 37(100722), 1–13.
Gopane, T. J., Moyo, T. N., & Setaka, L. F. (2023). Emerging market analysis of passive and active investing under bear and bull market conditions. Journal of Capital Market Studies, forthcoming.
Harmon, B. W., & Fisher, L. A. (2019). The Prudence of Passivity: An Argument for Default Passive Management in Trust Investing, ACTEC Law Journal, 44(2), 147–182.
Hirschel, P., & Krige, J. D. (2010). Characterization of South African Equity Unit Trusts Using the Active Share Measure as a Performance Indicator. Studies in Economics and Econometrics, 34(1), 53–82.
Huij, J., & Post, T. (2011). On the performance of emerging market equity mutual funds. Emerging Markets Review, 12(3), 238–249.
Iress. (2023). Dataset. Iress online database. Available at www.Iress.com.
Jensen, M. C. (1968). The performance of mutual funds in the period 1945-1964. The Journal of Finance, 23(2), 389–416.
Jones R. C., & Wermers, R. (2011). Active Management in Mostly Efficient Markets. Financial Analysts Journal, 67(6), 29–45.
Kahneman, D., & Tversky, A. (1972). Subjective Probability: A Judgement of Representativeness. Cognitive Psychology, 3(3), 430–54.
Kahneman, D. & Tversky, A. (1973). On the Psychology of Prediction. Psychological Review, 80(4), 237–251.
Kahneman, D., & Tversky, A. (1979). Prospect Theory: An Analysis of Decision under Risk. Econometrica, 47, 263–291.
Kalima, B., & Gopane, T. J. (2022). Portfolio performance under dynamic, systematic risk and conditional betas: The South African unit trust market. Applied Econometrics, 66, 85–98.
Kole, E., & Van Dijk, D. (2017). How to Identify and Forecast Bull and Bear Markets. Journal of Applied Econometrics, 32, 120–139.
Kaushik, A., Pennathur, A., & Barnhart, S. (2010). Market timing and the determinants of performance of sector funds over the business cycle. Managerial Finance, 36(7), 583–602.
Kunjal, D., Peerbhai, F., & Muzindutsi, P. F. (2021). The performance of South African exchange-traded funds under changing market conditions. Journal of Asset Management, 22, 350–359.
Leippold, M., & Rueegg, R. (2020). How Rational and Competitive is the Market for Mutual Funds? Review of Finance, 24(3), 579–613.
Lisauskiene, N., & Darskuviene, V. (2021). Linking the Robo-advisors Phenomenon and Behavioural Biases in Investment Management: An Interdisciplinary Literature Review and Research Agenda. Organizations and Markets in Emerging Economies, 12(2), 459–477.
Lo, A. W. (2002). The Statistics of Sharpe Ratios. Financial Analysts Journal, 58(4), 36–52.
Malefo, B. K., Hsieh, H, & Hodnett, K. (2016). Performance evaluation of actively managed mutual funds. Investment Management and Financial Innovations, 13(4), 188–195.
Meyer-Pretorius, M. C., & Wolmarans, H. P. (2006). The unit trust industry in South Africa from 1965 to June 2005: Are investors better off? Meditari Accountancy Research, 14(1), 49–67.
Millo, Y., Spence C., & Valentine, J. J. (2023) Active fund managers and the rise of passive investing: Epistemic opportunism in financial markets. Economy and Society, 52(2), 227–249.
Monga R., Aggrawal, D., & Singh, J. (2022). Smart Beta Investing: An Alternative Investment Paradigm in Emerging Indian Equity Market. Organizations and Markets in Emerging Economies, 13(1), 209–237.
Nyakurukwa, K., & Seetharam, Y. (2023). Alternatives to the efficient market hypothesis: An overview. Journal of Capital Markets Studies, 7(2), 111–124.
Ozcelebi, O., & Izgi, M. T. (2023). Assessing the Impacts of Economic Policy Uncertainty of the US on the Exchange Rates and Stock Returns of Korea, Mexico, Poland and Russia. Eastern European Economics, 61(1), 1–22.
Paramita, V. S., Jafar, B., & Siregar, I. W. (2017). Market timing and stock selection performance of mutual fund in bull and bear market condition. International Journal of Monetary Economics and Finance, 10(3–4), 309–321.
Pedersen, C. S., & Rudholm-Alfvin, T. (2003). Selecting a risk-adjusted shareholder performance measure. Journal of Asset Management, 4(3),152–172.
Perron, P. (2006). Dealing with structural breaks. In T. C. Mills & K. Patterson (Eds.), Palgrave Handbook of Econometrics: Econometric Theory, Vol I, (pp. 278–352). Basingstoke, UK: Palgrave.
Reddy, Y. V., & Dhabolkar, P. (2020). Pricing Efficiency of Exchange Traded Funds in India. Organizations and Markets in Emerging Economies, 11(1), 244–268.
Sharpe, W. F. (1966). Mutual Fund Performance. The Journal of business, 39(1), 119–138.
Sharpe, W. F. (1991). The Arithmetic of Active Management. Financial Analysts Journal, 47(1), 7–9.
Sharpe, W. F. (1992). Asset Allocation: Management Style and Performance Measurement. Journal of Portfolio Management, 18(2), 7–19.
Sharpe, W. F. (1994). The Sharpe Ratio. The Journal of Portfolio Management, 21(1), 49–58.
Shiller, R. J. (2003). From Efficient Markets Theory to Behavioral Finance. Journal of Economic Perspectives, 17(1), 83–104.
Schroth, J. (2021). Macroprudential policy with capital buffers. Journal of Monetary Economics, 118, 296–311.
Tan, O. (2015). Mutual Fund Performance: Evidence from South Africa. Emerging Markets Journal, 5(2), 49–57.
Thaler, R. H. (1999). The End of Behavioral Finance. Financial Analysts Journal, 55(6), 12–17.
Toerien, F., Badat, M., & Zille, N. (2022). Do actively managed mutual funds deliver positive risk-adjusted performance in emerging markets? The case of South African equity unit trusts. African Review of Economics and Finance, 14(2), 103–118.
Willis, M. S., & Chung, H. (2022). Noteworthy developments: Permission to adduce expert evidence on the investment market. The Liaison, Labaton Sucharow LLP, 1 June, 1–18.
Appendix
Table A1
Test for Structural Breaks with Unknown Break Dates for ALSI
|
Ho: No structural break |
|||
|
Test for Sample: |
Statistic |
P-value |
Decision |
|
Supremum Wald |
1.9246 |
0.9336 |
Ho not rejected |
|
Average Wald |
0.2756 |
0.9203 |
Ho not rejected |
|
Exponential Wald |
0.1531 |
0.9661 |
Ho not rejected |
|
Supremum Likelihood Ratio |
1.9511 |
0.9291 |
Ho not rejected |
|
Average Likelihood Ratio |
0.2806 |
0.9158 |
Ho not rejected |
|
Exponential Likelihood Ratio |
0.1561 |
0.96 |
Ho not rejected |
Note. Sample: December 9, 2011 and October 3, 2014. Source: Authors’ computation.
Table A2
BDS Test for ALSI
|
Dimension |
BDS Stat |
Std. Error |
z-Stat |
Prob. |
|
2 |
-0.006 |
0.006 |
-1.060 |
0.289 |
|
3 |
-0.007 |
0.009 |
-0.757 |
0.449 |
|
4 |
0.006 |
0.011 |
0.563 |
0.573 |
|
5 |
0.010 |
0.011 |
0.890 |
0.373 |
|
6 |
0.012 |
0.011 |
1.123 |
0.261 |
Note. Sample: 12/09/2011 and 10/03/2014. Source: Authors’ computation.
Figure A1
CUSUM Test for JSE Allshare Index (ALSI)
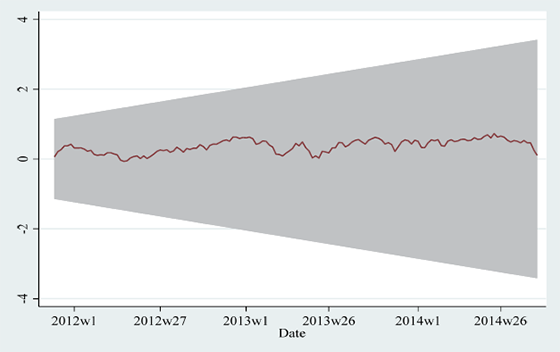
Note. The shaded area is the confidence bands of 99% around the null. Since the graphical line of ALSI does not break outside the confidence interval (shaded area), there is evidence of no structural break at 1% level. Source: Authors’ graphics.
Figure A2
Standard Statistical Graphs to Diagnose Normal Distribution
Note. In Panel A (quantiles of ALSI against quantiles of normal distribution), since the dotted line does not deviate much from the straight line, then this is reasonable evidence of normality. In Panel B, since the kernel density estimate of ALSI does not deviate much from the theoretical bell shape of normal distribution, this is reasonable evidence of normality. Source: Authors’ graphics.