Organizations and Markets in Emerging Economies ISSN 2029-4581 eISSN 2345-0037
2022, vol. 13, no. 2(26), pp. 443–466 DOI: https://doi.org/10.15388/omee.2022.13.88
Does Financial Inclusion Reduce Poverty in Niger State? Evidence from Logistic Regression Technique
Nurudeen Abu (corresponding author)
Baba Ahmed University, Nigeria
https://orcid.org/0000-0002-9843-977X
abu.nurudeen@yahoo.com
Musa Abudullahi Sakanko
University of Jos, Nigeria
https://orcid.org/0000-0002-5203-5462
sakanko2015@gmail.com
Joseph David
Lagos Business School, Nigeria
https://orcid.org/0000-0002-1357-5618
josephdavid970@gmail.com
Awadh Ahmed Mohammed Gamal
Universiti Pendidikan Sultan Idris, Malaysia
https://orcid.org/0000-0002-8529-951X
awadh.gamal@fpe.upsi.edu.my
Ben Obi
University of Abuja, Nigeria
https://orcid.org/0000-0002-6093-7378
benonyi@yahoo.com
Abstract. This study employs the logistic regression method to examine the effect of financial inclusion on the level of poverty in Niger State of Nigeria based on cross-sectional data randomly collected from 624 respondents across 224 towns and villages in 12 local government areas (LGAs) of the state. The estimation results illustrate that financial inclusion (proxied by bank account ownership, including access to bank, credit, and mobile phone) is significantly and negatively related to the level of poverty. This empirical outcome is further validated by the results of the Probit regression technique which show a significant negative relationship between financial inclusion and poverty in the state. Based on these empirical findings, the study recommends policies which include broadening bank coverage, softening credit requirements, and enhancement of people’s access to mobile phone and internet services in rural areas of Niger state.
Keywords: poverty, financial inclusion, logistic regression method, Probit regression technique, Niger state
Received: 25/7/2022. Accepted: 2/11/2022
Copyright © 2022 Nurudeen Abu, Musa Abudullahi Sakanko, Joseph David, Awadh Ahmed Mohammed Gamal, Ben Obi. Published by Vilnius University Press. This is an Open Access article distributed under the terms of the Creative Commons Attribution Licence, which permits unrestricted use, distribution, and reproduction in any medium, provided the original author and source are credited.
1. Introduction
The persistent rise in the level of poverty is increasingly becoming a great concern to government and policymakers across the world. Thus, the reduction of poverty has formed the basis of discussions and policy formulation among world leaders, politicians, economists and development experts. This has led to the implementation of strategies and/or programmes from the perspectives of education, national output growth, employment creation, asset ownership, and management of macroeconomic variables, among others, in a bid to address the rising poverty level (Alie, 2015; Djamaluddin, 2017; Gafaar & Osinubi, 2005; Lord, 2001; Majumder & Biswas, 2017; Roemer & Gugerty, 1997; Sakanko & David, 2018).
In recent times, financial inclusion – the access to a host of quality financial services and products (savings, loans, insurance, credit, etc.,) by the disadvantaged segment of the population at affordable costs – has assumed a greater significance (Bhandari, 2009; Sakanko et al., 2020). This is on account of its potentials in driving sustained economic growth and development (Demirgüç-Kunt et al., 2018), and most importantly, reducing poverty (Bakari et al., 2019; Bhandari, 2009; Grant & Kangan, 2019; Nanda & Kaur, 2016; Onaolapo, 2015; Sakanko et al., 2020; Honohan, 2008). The argument in favour of financial inclusion as the panacea for poverty reduction is due in part to its capacity to boost credit creation, raise capital accumulation and induce investment boom, leading to higher effective demand, employment and income generation, and consequently, lowering the poverty level (Bakari et al., 2019; Demirgüç-Kunt et al., 2018; Sakanko et al., 2020).
The realisation of the role of financial inclusion in alleviating poverty, therefore, has led to the adoption of policies/measures aimed at enhancing global financial inclusion (Sakanko et al., 2019). Despite this general consensus, achieving pervasive financial inclusion has remained a daunting task particularly in Sub-Saharan African (SSA) and low-income nations (Demirgüç-Kunt et al., 2018; Kama & Adigun, 2013). Given that more than half of the extremely poor live in SSA countries, it has been argued that the low level of financial inclusion might have contributed to sustained increase in the level of poverty in the region (Bakari et al., 2019).
Like in most developing countries, Nigeria has witnessed the coexistence of the rising level of poverty and financial exclusion. Despite the presence of enormous natural and human resources, statistics by the Nigeria’s National Bureau of Statistics (NBS) in 2020 illustrate that the percentage of the population living in poverty rose from about 30.3 percent in 2010 to more than 40 percent in 2019. It is not surprising therefore that in 2018, the country was accorded the status of “world poverty capital” due to the incidence of extreme poverty among over 90 million of its population (Sakanko et al., 2020). Coincidentally, statistics from the Central Bank of Nigeria (CBN) indicate that the percentage of adult population that is financially included declined from 53.7 percent in 2010 to 40.0 percent in 2017, thus implying that over half of the country’s adults are financially excluded (CBN, 2018; Demirgüç-Kunt et al., 2018).
In addition, the prevalence of poverty incidence is higher in rural areas and the Northern region of Nigeria which are significantly financially excluded (CBN, 2018; NBS, 2020). Unlike most states in the region, Niger state was hitherto one of the few with the least incidence of poverty due in part to the presence of fertile agrarian land that supports the livelihood of over 80 percent of its population and economy (NBS, 2019; Niger State Bureau of Statistics [NSBS], 2013). However, partly on account of the spate of insecurity occasioned by the activities of Fulani herdsmen and Boko-Haram/ISWAP terrorists in mostly rural areas of the state where majority are farmers, incidence of poverty rose from 33.8 percent in 2010 to about 66.1 percent in 2019, with over 38 percent of the population being financially excluded (Enhancing Financial Innovation and Access [EFInA], 2019; NBS, 2012, 2020).
Given the rising levels of poverty and financial exclusion in Nigeria, a number of empirical studies have been conducted to evaluate the relationship between financial inclusion and poverty (Abimbola et al., 2018; Ajide, 2015; Akinlo & Akinwumi, 2020; Ayopo et al., 2020; Eze & Alugbuo, 2021; Hussaini & Chibuzo, 2018; Ogunsakin & Fawehinmi, 2017; Okoye et al., 2017; Onaolapo & Odetayo, 2012; Sakanko et al., 2018). However, a survey of the literature on financial inclusion–poverty linkage suggests that there is dearth of such studies concentrating on Niger state despite the marked increase in the incidence of poverty within a few years and the high number of financially excluded in the state. Therefore, the main objective of the present study is to investigate the financial inclusion–poverty relationship in Niger state.
In light of the above reasons, the current study is relevant and makes contribution to the existing literature in a number of ways. First, the study is a pioneering effort to examine the financial inclusion–poverty connection in the context of Niger state, Nigeria. The rationale/motivation to examine this relationship is due to the rapid increase in the incidence of poverty and high level of financial exclusion among the populace. Perhaps, the most important reason for choosing the state is its transitioning from one of the states with the least poverty level in Nigeria’s Northern region to one of those with high level of poverty in the country within a space of few years. Second, the current study considers variables such as access to telecommunication and internet services alongside the traditional measures of financial inclusion (i. e., account ownership, access to bank and credit facility), thus, our measure of financial inclusion is more comprehensive compared to existing studies on Nigeria. Third, this study employs both Logit and Probit regression techniques. These methods are particularly robust and well-suited to exploring the relationship between poverty and financial inclusion given the binary nature of the response variable. Moreover, by using these methods of analysis, we can ascertain the consistency and robustness of the results generated. Lastly, the outcome of the study on Niger state can be generalised for all Northern states due to their homogeneity in terms of cultural, religious, and socio-economic characteristics.
The remainder of this study is arranged as follows. Section two is the review of empirical literature on financial inclusion and poverty, while the methodology is explained in the third section. The results are presented and discussed in the fourth section, and the last section is for conclusion and policy implication.
2. Review of Empirical Literature on Financial Inclusion and Poverty Relationship
Over time, authors have examined the connection between financial inclusion and poverty from cross-country or country-specific perspectives, using different measures of financial inclusion and estimation approaches. For instance, certain researchers have investigated the influence of financial inclusion on poverty (and income inequality) in cross-country studies, focusing on a group of developing countries in Asia, Latin America, SSA, and Europe (Abiona & Koppensteiner, 2022; Aracil et al., 2022; Bakari et al., 2019; Barik & Pradhan, 2021; Coulibali & Yogo, 2016; Cyn-Young & Rogelio, 2015, 2018; Demir et al., 2022; Dogan et al., 2022; Fadum, 2014; Jabir, 2015; Omar & Inaba, 2020; Polloni-Silva et al., 2021). These studies confirmed that financial inclusion lowers poverty level. On the other hand, some studies explored the relationship at the level of an individual country including India and Indonesia (Anwar et al., 2016; Anwar & Amrullah, 2017; Gunarsih et al., 2018; Murari & Manish, 2010). The authors concluded that financial inclusion and poverty are inversely related. Yet, few studies concentrating on India, Peru and countries in Middle East and North African (MENA) region illustrated that financial inclusion is not significantly related to decline in poverty level (Bhandari, 2009; Neaime & Gaysset, 2017; Schmied & Marr, 2016).
In Nigeria, attempts have also been made to assess financial inclusion–poverty relationship. Some of the studies focused on the entire country (Abimbola et al., 2018; Ajide, 2015; Eze & Alugbuo, 2021; Okoye et al., 2017; Onaolapo & Odetayo, 2012), while others were conducted from the perspective of the federating units (states) and/or local governments including Ekiti, Kebbi, Lagos, Ogun, Ondo, Osun, Oyo, and Minna (Akinlo & Akinwumi, 2020; Ayopo et al., 2020; Hussaini & Chibuzo, 2018; Ogunsakin & Fawehinmi, 2017; Sakanko et al., 2018). Their findings suggested that poverty and financial inclusion are negatively related.
It is obvious from the literature that, while studies on the poverty–financial inclusion linkage abound, researchers have paid less attention to the evaluation of the relationship between poverty and financial inclusion in Niger state. Besides, most of the existing studies in Nigeria either considered the relationship from a macro perspective (i.e., in terms of the whole country) or focused on regions or states with the least level of poverty in the country. Therefore, the present study extends the literature by explicitly examining the effect of financial inclusion on poverty in Niger state.
3. Methodology
3.1 Sampling Technique and Sample Size
A cross-sectional field survey research design was employed in this study. The approach involves seeking a response from households, while the independent and dependent variables were measured at the same point using questionnaires. The choice of field survey as opposed to other research designs is motivated by the following reasons. First, field survey provides a suitable instrument for collecting a large amount of data. Second, it provides a practical tool for collecting a large sample of the composing group. Third, data collected in the field are subject to external validity. Fourth, it is a tool for measuring unobserved variables which include individuals’ preferences, attitude, beliefs, and behaviour. Finally, field surveys have strong data reliability.
In line with the objective of this study, the target population comprises all adults in the 25 local government areas (LGAs) of Niger state. According to the CBN (2020), the estimated population of the state is 5,556,247. However, due to the large population size and the fact that it is not feasible to study all the LGAs, a multistage random sampling technique was used. The technique involves the division of the population into groups, allowing the researchers to choose the samples randomly at each stage. The method is flexible, cost-effective, and time-effective because it helps to cut down the population into smaller groups from which the researchers can choose.
The multistage random sampling procedure was first employed to partition the state along three geopolitical zones, that is, Niger South, Niger East, and Niger North. Nine (9) LGAs make up each of Niger East and Niger North, while Niger South consists of 8 LGAs. Next, four (4) LGAs were randomly selected from each geopolitical zone. Following this procedure, 12 LGAs were selected, with a total population size of 3,237,600. The selected LGAs include Bida, Lavun, Lapai and Mokwa for Niger South; Bosso, Chanchaga, Shiroro and Suleja for Niger East; and Kontagora, Mariga, Magama and Mashegu for Niger North. It is imperative to mention that the selection of the LGAs was guided by population distribution and socio-economic factors (such as economic activities, culture, industries, religion, etc.). Also, since it is not possible to consider all the towns and villages in the selected LGAs, 224 towns and villages were randomly selected and studied.
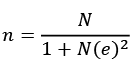
The sample size was determined using Slovin’s formula (Slovin, 1960) given as:
 (1)
(1)
where N denotes the population size, and e represents error tolerance.
For the purpose of the present study, the population size (N) is 3,237,600 and error tolerance/margin of error (e) is 0.04 (or 4 percent). The conventional margin of error is 1 percent, 5 percent, and 10 percent. However, since these values were either too small or large, and unable to provide the desired sample size, we decided to choose 4 percent as the margin error. This is in line with Smith (1991), who suggested that researchers can choose a confidence interval that gives the required sample size.
Therefore, following this procedure, the sample size (n) is approximately 624. The sample frame selected is as broad as the target population, as no preference towards gender and religion was made. All adult populations were randomly selected which make up the sample frame. That is, 624 adults were randomly selected to fill in the questionnaires.
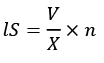
The sample frame is calculated using:
 (2)
(2)
where S denotes sample frame, V is the population of the LGA, X represent the total population size, and n is sample size. The sample frame of the selected LGAs within the three geopolitical zones is presented in Table 1.
Table 1
Sample Frame of Selected LGAs
|
Zone |
LGA |
Population |
Sample Frame |
Total |
|
Niger South |
Bida |
260,700 |
50 |
205 |
|
Lavun |
164,400 |
57 |
||
|
Lapai |
294,700 |
32 |
||
|
Mokwa |
341,200 |
66 |
||
|
Niger East |
Bosso |
208,100 |
40 |
216 |
|
Chanchaga |
284,000 |
55 |
||
|
Shiroro |
331,100 |
63 |
||
|
Suleja |
302,200 |
58 |
||
|
Niger North |
Kontagora |
213,500 |
41 |
203 |
|
Mariga |
280,400 |
54 |
||
|
Magama |
302,300 |
58 |
||
|
Mashegu |
255,000 |
50 |
||
|
Total |
12 |
3,237,600 |
624 |
624 |
Source: Authors’ computation using summarise function in Stata 14 based on data collected.
The questionnaire employed consists of a series of questions which are intended to gather information from target populations. The design of the questionnaire is simple and respondent-friendly. The questions were divided into three sections; section A contains questions on the socioeconomic characteristics of respondents; section B is based on financial inclusion and poverty, and section C focuses on the determinant of financial inclusion in the state. To elicit the cooperation of respondents, the nature and purpose of the research was made known to the respondents, and anonymity was assured.
All questionnaires were personally administered by the researchers to ensure accurate and prompt feedback. Data collected were assembled and stored in both hard and soft copies for further analysis. The data collection process took approximately one month. For respondents that needed assistance, the researchers read through the questionnaire and interviewed the respondents to ensure a common understanding of the questions and the ability to answer them correctly.
3.2 Survey Instruments
Using a questionnaire has a major advantage due to its ability to collect large amount of information at a point within limited period of time. To ensure uniform response, most questions on the socio-economic characteristics of the respondents, and the extent of financial inclusiveness in the questionnaire were close-ended. To elicit the cooperation of the respondents, the purpose of the research was made known to them, and anonymity was assured. To ensure that the data were accurate, some of the co-authors alongside their research assistants personally administered the questionnaires. For respondents with peculiar needs, the co-authors and/or their assistant conducted oral interview with the respondents, while indicating the response of the individuals accordingly. For easy collation and ascertaining accuracy of data collected, completed questionnaires were sent to one of the co-authors working remotely (without delay) for data analysis to uncover likely outliers and storage. This ensured that questionnaires with problems were returned immediately for rectification.
Toeing the part of Smith (1991) to ascertain the extent to which the research instrument adequately represents the underlying construction and its ability to quantify what it is designed for, this study adopts the content validity test. The test performs better compared to others due to its ability in determining the extent to which the research instrument provides enough coverage of the study irrespective of the degree of the content represented in the construct of the questions.
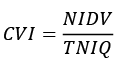
The content validity index of Amins (2005) was adopted, represented by the formula:
 (3)
(3)
where CVI is a content validity index, NIDV represents the number of items declared valid, and TNIQ denotes total number of items in the constructed questionnaire. For a research instrument to be adjudged reliable, it is required that the CVI exceeds the 0.7 minimum CVI for a survey study.
The results of the content validity test based on the opinion of three experts with adeptness on the issue under study are summarised in Table 2. The results illustrate that the overall CVI score is 0.93. Since the index exceeds the recommended minimum CVI score of 0.7 for a survey study, it can be concluded that the research instrument is valid.
Table 2
Results of Content Validity Test
|
S/N |
Experts |
Number of Valid |
Number of items |
CVI |
Remark |
|
1 |
Assessor One |
31 |
32 |
0.97 |
|
|
2 |
Assessor Two |
30 |
32 |
0.94 |
|
|
3 |
Assessor Three |
28 |
32 |
0.88 |
|
|
Total |
89 |
96 |
0.93 |
Acceptable |
|
Source: Authors’ computation.
3.3 Theoretical Framework and Model Specification
In the present study, we rely on the finance-growth model (Bencievenga & Bruce, 1983; Goldsmith, 1969; McKinnon, 1973; Shaw, 1973), to forge a link between poverty and financial inclusion. The basic theoretical assumption of the finance-growth model is that the absence of access to finance is an important determinant of persistent income inequality and sluggish growth, which ultimately lead to poverty. Therefore, access to a safe, easy and affordable source of finance has been identified as a requirement for improving growth performance, and thus the reduction of income disparities and poverty (Bakari et al., 2019; Demirgüç-Kunt et al., 2018; Grant & Kangan, 2019; Sakanko et al., 2020). This is premised on the argument that such access creates equal opportunities, enabling economically and socially excluded people to integrate better into the economy and actively contributing to the development of the economy including shielding themselves against economic shocks (Bakari et al., 2019; Demirgüç-Kunt et al., 2018; Sakanko et al., 2018; Sakanko et al., 2020).
Based on the discussion above, a simple functional relationship between poverty and financial inclusion can be summarised as follows:
 (4)
(4)
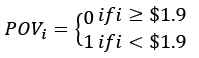
where FIi denotes the extent to which th individual is financially included, and POVi represents the poverty status of th individual defined as:
In economics literature, the level of financial inclusion is traditionally measured by the extent to which individuals are able to access financial institutions (banks) and credit facilities easily as well as ownership of an account with one or more financial institutions (Abdin, 2016; Ayopo et al., 2020; Fadum, 2014; Gunarsih et al., 2018; Ogunsakin & Fawehinmi, 2017; Sakanko et al., 2018; Sakanko et al., 2019; Sakanko et al., 2020). Recently, access to credit facilities from informal sources (such as thrift/adashi/esusu/ajo) and access to mobile phone and internet services have been assigned an important role (Akinlo & Akinwumi, 2020; Ayopo et al., 2020; Bakari et al., 2019).
Beside financial inclusion, evidence has shown that the level of poverty can be influenced by factors such as income level, educational qualification, employment, literacy rate and social security or transfers (Egunjobi, 2014; Mehmood & Sadiq, 2010; Muhammad & David, 2019; Ogbeide & Agu, 2015; Sakanko & David, 2018; Sakanko et al., 2018).
Taking these issues into account, the functional relationship in Equation (4) is rewritten as:
 (5)
(5)
where ACCOWNi represents account ownership of ith individual in a financial institution, BANK denotes access to banks and other financial institutions, CREDIT is access to credit facilities, INFMi denotes ith individual’s access to credit facilities from informal sources (thrift/adashi/esusu/ajo), PHONEi represents access of ith individual to mobile phone, TERNETi denotes ith individual access to internet services, and Zi is the vector of control variables (income level, educational qualification, literacy rate, employment, and access to social security).
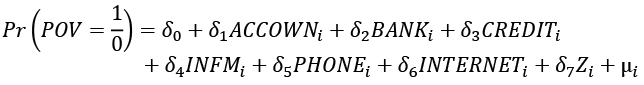
If Equation (5) is re-written in an explicit form, the model is specified as:
 (6)
(6)
where δ0 represents the intercept, δ1 – δ7 are the coefficients of the regressors, and µi denotes the stochastic disturbance term with a zero mean and constant variance.
In order to investigate the relationship between poverty and financial inclusion, we employ logistic regression method (also Logit model). The choice of this technique is guided by a number of reasons. First, the method is applied due to the dichotomous (binary) nature of the response variable (Dogan et al., 2022). In this case, the standard ordinary least squares (OLS) method may not be appropriate to examine the relationship (Gujarati, 2004). Second, the approach is flexible, mathematically simpler and it is not limited by problems of heteroscedasticity, non-normality of error term, and questionable R2 inherent in other linear probability methods (De Faria et al., 2020).
The Logit model can be written as:
 (7)
(7)
where  is the probability of being poor, and other identities as previously specified.
To ascertain the robustness and consistency of the estimates generated using the Logit method, the Probit regression model is employed to estimate financial inclusion and poverty relationship. The Probit model is quite similar to the Logit model, and both belong to the family of Generalised Linear Models (GLM). But the main difference between the two models lies in the linking function. Whereas the Logit model is based on cumulative Logistic function given by the inverse of the Logistic distribution, the Probit model uses the Probit function given by the cumulative normal distribution (De Faria et al., 2020; Gujarati, 2004). Yet, evidence suggests that the difference between the two is practically obscure in most situations (Gündüz & Fokoué, 2017).
The variables are measured as follows. We measure poverty based on the World Bank’s international poverty line of US$1.90 per day, thus taking the value of 1 if the respondent spends below the Naira equivalent of US$1.9 per day and 0 if otherwise. Although Edward (2006) suggested that this measure tends to trivialise the complexity of poverty, the major advantage of using the approach lies in its international comparability of the extent of (extreme) poverty across countries (Abiona & Koppensteiner, 2022; Aracil et al., 2022; Polloni-Silva et al., 2021). In addition, the measures of financial inclusion (ACCOWN,BANK,CREDIT,INFM,PHONE and INTERNET) are based on the responses of individuals to close-ended questions. Lastly, the income range is used to measure income level (INCL) of individuals, educational qualification (EDU) and literacy rate (LIT) are captured by respondents’ highest educational attainment and literacy status, while access to social security (SOSEC) is measured by the access of respondents to social safety nets.
4. Results and Discussion
4.1 Descriptive Statistics
Prior to examining the financial inclusion-poverty linkage, the descriptive statistics of the characteristics of the respondents were computed and the results summarised in Table 3. The results illustrate that the majority of the respondents (about 84.29 percent of the total respondents) reside in rural areas, while the rest (about 15.71 percent) are urban dwellers. Also, more than half of the respondents (331) are male, while females account for about 46.96 percent (equivalent to about 293 respondents). Further, about two-thirds of the respondents are between the age of 18 and 30, and a sizable number are either married (47.75 percent) or single (28.21 percent).
In addition, about 58.81 percent (equivalent to 367 respondents) are able to read and write, while the rest indicate their inability to read or write. Despite the high literacy rate, about 55.13 percent of the respondents (equivalent to about 344) do not possess any form of educational qualification. Moreover, the majority of the respondents (about 79.49 percent) are unemployed. More so, most of the respondents earn between US$41 – US$80 per month, about one-third earn less than US$20, and a few (equivalent to about 1.28 percent) earn above US$200 per month. More so, only 44.55 percent of the respondents benefited from social security in the form of cash, food, and scholarship from the government, international organisations or religious bodies.
Table 3
Descriptive Statistics
|
Variable |
Obs. = 624 |
Percentage |
|
LOCALITY |
|
|
|
Urban |
98 |
15.71 |
|
Rural |
526 |
84.29 |
|
GENDER |
|
|
|
Male |
331 |
53.04 |
|
Female |
293 |
46.96 |
|
AGE |
|
|
|
18 – 30 |
412 |
66.03 |
|
31 – 50 |
145 |
23.2 |
|
51 – 60 |
31 |
4.96 |
|
61 and above |
36 |
5.76 |
|
MARITAL STATUS |
|
|
|
Single |
176 |
28.21 |
|
Married |
298 |
47.75 |
|
Divorced/Separated |
134 |
21.48 |
|
Widowed |
16 |
2.56 |
|
LITERACY |
|
|
|
Literate |
367 |
58.81 |
|
Illiterate |
257 |
41.19 |
|
EDUCATIONAL QUALIFICATION |
|
|
|
None |
344 |
55.13 |
|
FSLC |
47 |
7.53 |
|
Vocational Certificate |
1 |
0.16 |
|
Secondary School Certificate |
152 |
24.36 |
|
NCE/OND |
27 |
4.33 |
|
B.A./B.Sc./HND |
50 |
8.01 |
|
Others |
3 |
0.48 |
|
EMPLOYMENT STATUS |
|
|
|
Employed |
128 |
20.51 |
|
Unemployed |
496 |
79.49 |
|
INCOME LEVEL |
|
|
|
Below US$20 |
205 |
32.85 |
|
US$20 – US$40 |
281 |
44.96 |
|
US$41– US$80 |
99 |
15.84 |
|
US$81 – US$160 |
24 |
3.84 |
|
US$161– US$200 |
7 |
1.12 |
|
Above US$200 |
8 |
1.28 |
|
SOCIAL SECURITY |
|
|
|
Accessed |
278 |
44.55 |
|
Not accessed |
346 |
55.45 |
Note. Naira/US Dollars exchange rate is 500/$. FSLC denotes the first school leaving certificate, equivalent of the elementary school diploma in the United States.
Source: Authors’ computation using summarise function in Stata 14 based on data collected.
The consumption expenditure pattern of individuals presented in Figure 1 illustrates that the average daily consumption expenditure of the majority of the respondents (about 33.17 percent – 207 individuals) falls within the US$0.51 – US$0.75 range, while 14.26 percent and 14.90 percent spend between US$1.1 – US$1.90, and above US$1.90 per day, respectively.
Figure 1
Respondents’ Daily Consumption Expenditure
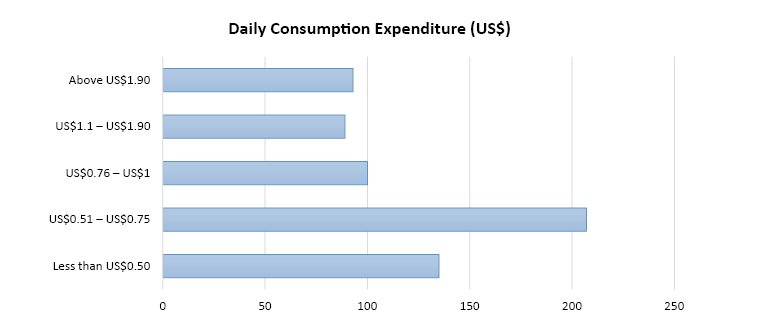
Note: Naira/US Dollars exchange rate is NGN399.96/US$
Source: Authors’ computation based on data collected.
Thus, it is apparent that based on the World Bank’s international US$1.90 per day measure of poverty, the majority of the respondents would be adjudged poor, an indicator that the incidence of poverty is prevalent in the studied sample, with only about 22.92 percent of the sample (equivalent to 143 respondents) expending US$1.90 and above per day, on average.
Furthermore, the financial inclusion characteristics of the respondents presented in Figure 2 reveal that majority of the respondents (accounting for about 53.85 percent of the individuals) have an account with at least one financial institution (commercial or microfinance bank). Whereas respondents with accounts indicate that the main reason for opening an account is to enable them to access credit facilities and their salaries, individuals without an account submitted that distance, cost of financial services, absence of necessary documents, and lack of trust in financial institutions are the major reasons why they do not have an account with any financial institution. Besides, the majority of the respondents (about 83.81 percent) do not have access to banks and other financial institutions or bank agents due to their absence in their community. Despite the lack of access to financial institutions, about 57.53 percent of the respondents have access to credit facilities as they have received a loan from financial institutions in the recent past. In addition, it was discovered that most of the respondents (526 – representing 84.29 percent) have a mobile phone, while 32.05 percent have access to internet services. Although the majority of the respondents are rural dwellers, most of them do not use informal savings group (adashi/esusu/ajo) as only 28.37 percent rely on credit facilities through informal sources.
Figure 2
Extent of Respondents’ Access to Financial Services and Products
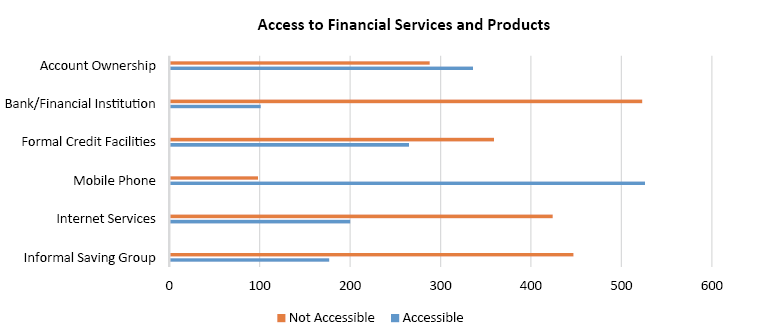
Source: Authors’ computation based on data collected.
4.2 Correlation Analysis
In addition to the descriptive statistics, we compute the correlation analysis for the variables. The results reported in Table 4 illustrate that elements of financial inclusion (account ownership, access to banks and other financial institutions, and access to credit facilities) have weak, albeit negative and significant correlation with poverty. In addition, there is a weak but positive and significant correlation between the elements of financial inclusion. Moreover, there is a weak negative and significant correlation between poverty and education (-0.09), literacy rate (-0.36) and social security (-0.21). Further, it is indicated that poverty and access to mobile phone (-0.48), and poverty and employment (-0.41) exhibit a significant negative correlation. However, access to credit facilities from informal sources (thrift/adashi/esusu/ajo), access to internet services, and income level are not significantly associated with poverty.
Table 4
Results of Correlation Analysis
|
|
A |
B |
C |
D |
E |
F |
G |
H |
I |
J |
K |
L |
|
A |
1 |
|
|
|
|
|
|
|
|
|
|
|
|
B |
-.33 |
1 |
|
|
|
|
|
|
|
|
|
|
|
C |
-.29 |
.39 |
1 |
|
|
|
|
|
|
|
|
|
|
D |
-.34 |
.17 |
.18 |
1 |
|
|
|
|
|
|
|
|
|
E |
.06 |
.04 |
.03 |
.01 |
1 |
|
|
|
|
|
|
|
|
F |
-.48 |
.18 |
.17 |
.15 |
-.004 |
1 |
|
|
|
|
|
|
|
G |
.04 |
-.03 |
-.04 |
-.01 |
-.01 |
-.01 |
1 |
|
|
|
|
|
|
H |
-.05 |
.03 |
.04 |
.03 |
-.02 |
.02 |
.07 |
1 |
|
|
|
|
|
I |
-.09 |
.21 |
.16 |
-.05 |
.03 |
.01 |
-.05 |
-.05 |
1 |
|
|
|
|
J |
-.36 |
.25 |
.19 |
.09 |
-.02 |
.15 |
.02 |
-.04 |
.42 |
1 |
|
|
|
K |
-.41 |
.13 |
.15 |
.15 |
-.12 |
.23 |
-.02 |
.19 |
-.03 |
.15 |
1 |
|
|
L |
-.21 |
.14 |
.10 |
.26 |
.09 |
.17 |
.09 |
-.03 |
.03 |
.07 |
.05 |
1 |
Note. Asterisks (***), (**) and (*) denote statistical significance at 1%, 5% and 10% levels, respectively. A: POV = poverty; B: ACCOWN = account ownership; C: BANK = access to banks and other financial institutions; D: CREDIT = access to credit facilities; E: INFM = access to credit facilities from informal sources (thrift/adashi/esusu/ajo); F: PHONE = access to mobile phone; G: INTERNET = access to internet services; H: INCL = income level; I: EDU = educational qualification; J: LIT = literacy rate; K: EMPL = employment; L: SOSEC = access to social security;
Source: Authors’ computation using pwcor function in Stata 14.
4.3 Results of Estimation of the Logit Regression Model
The estimation results of the Logit model in Table 5 demonstrate that account ownership, including access to financial institutions, formal credit facilities and mobile phone are negatively related to the level of poverty, and the relationships are significant at the 1 percent level. A unit change in the probability of an individual opening an account with a financial institution will likely lead to a reduction in the log of odds of poverty by 2.31. Also, a unit change in the probability of respondents having access to a bank or any financial institution is likely to reduce the log of the odds of poverty by 1.89. More so, a unit increase in the likelihood of respondents having access to credit facility reduces the log of the odds of poverty by 3.24. In addition, a unit increase in the possibility of respondents having access to a mobile phone is likely to reduce the log of the odds of poverty by 3.56. With regard to the marginal effect of these factors on poverty level, the results suggest that the possible increase in the number of account ownership, access to bank and financial institutions, access to credit facilities and access to mobile phone reduce the level of poverty by 0.17 percent, 0.12 percent, 0.32 percent, and 0.70 percent, respectively.
Table 5
Estimation Results of Logit Model
|
Regressor |
Coefficient |
Standard Error |
Z-statistic |
Prob. |
dy ⁄dx |
|
Constant |
5.135 |
1.036 |
4.96*** |
0.000 |
– |
|
ACCOWN |
-2.311 |
0.748 |
-3.09*** |
0.002 |
-0.0017 |
|
BANK |
-1.887 |
0.702 |
-2.69*** |
0.007 |
-0.0012 |
|
CREDIT |
-3.245 |
0.789 |
-4.11*** |
0.000 |
-0.0032 |
|
INFM |
0.623 |
0.661 |
0.94 |
0.346 |
0.0003 |
|
PHONE |
-3.559 |
0.693 |
-5.14*** |
0.000 |
-0.0069 |
|
INTERNET |
-0.509 |
0.663 |
-0.77 |
0.443 |
-0.0002 |
|
INCL |
-0.001 |
2.73E-05 |
-1.83* |
0.067 |
-2.14E-08 |
|
EDU |
0.346 |
0.271 |
1.28 |
0.202 |
0.00015 |
|
LIT |
-3.322 |
0.999 |
-3.32*** |
0.001 |
-0.0036 |
|
EMPL |
-3.409 |
0.735 |
-4.64*** |
0.000 |
-0.0044 |
|
SOSEC |
-2.557 |
1.206 |
-2.12** |
0.034 |
-0.0009 |
|
No. of Observations |
624 |
|
|||
|
LRχ2 (11) |
309.07 |
0.0000 |
|||
|
Pseudo R2 |
0.782 |
|
|||
Note. Asterisks (***), (**) and (*) indicate significance at the 1%, 5% and 10% level, respectively.
Source: Authors’ computation using Logitand mfx functions in Stata 14 based on data collected.
The results also illustrate that income level, literacy rate, employment status, and access to social security are significant and negatively associated with poverty level. A unit increase in income of respondents leads to a reduction in the log of the odds of poverty by 0.0001. More so, an increase in the likelihood of respondents being literate reduces the log of odds of poverty by 3.32. Further, a unit increase in the possibility that an individual is employed is likely to reduce the log of the odds of poverty by 3.41. In addition, the log of odds of poverty decreases by 3.41 following a unit increase in the probability of accessing social security. In addition, the results of the marginal effect demonstrate that an increase in income level leads to a decrease in poverty level by 0.00000214 percent, while an increase in literacy rate, employment and access to social security results in a reduction in poverty level by 0.36 percent, 0.44 percent, and 0.09 percent, respectively. However, access to the internet, educational qualification and informal saving source are not significantly related to poverty level.
4.4 Results of Diagnostic Tests (Logit Regression Model)
The results of diagnostic tests are reported in Table 6. The results of the link test for specification error and Hosmer-Lemeshow’s goodness-of-fit test alongside their corresponding probability values illustrate that the estimated model is free from misspecification error or bias and fits the data well. Also, the heteroscedasticity LM test statistic and its associated probability demonstrate that the estimated model is free from the problem of heteroscedasticity.
Table 6
Results of Diagnostic Tests (Logit Model)
|
Test |
Statistic |
Prob. |
|
_hat |
6.29 |
0.000 |
|
_hatsq |
0.020 |
0.982 |
|
χ2 HL |
0.530 |
0.999 |
|
χ2 HET |
2.80 |
0.993 |
Note. _hat and _hatsq denote linear predicted value and linear predicted value squared of the linktest. χ2 HET represents heteroscedasticity LM test statistics. χ2 HL is Hosmer-Lemeshow’s goodness-of-fit test statistic.
Source: Authors’ computation using linktest,lfit, Logit, predictandtest functions in Stata 14.
We also test the presence or otherwise of linear correlation between the explanatory variables. While evidence suggests that the presence of severe multicollinearity in a model can be ascertained when the standard errors of the coefficients are very large (inflated) or when the overall model is significant but none or most of the coefficients are, researchers often use the variance inflation factor (VIF) and the tolerance tests to determine the existence of multicollinearity between variables in a model. Generally, a VIF greater than 4 or a tolerance below 0.25 are a cause for concern, while a VIF value of 10 and above and tolerance value of 0.1 or less indicate a serious collinearity problem. The VIF and tolerance computed for the variables (Table 7) indicate that the model is also free from multicollinearity problem. Thus, the results can guide policy formulation.
Table 7
Results of Multicollinearity Test
|
Variable |
VIF |
Tolerance |
|
ACCOWN |
1.31 |
0.7623 |
|
BANK |
1.26 |
0.7954 |
|
CREDIT |
1.20 |
0.8307 |
|
PHONE |
1.32 |
0.7595 |
|
INTERNET |
1.03 |
0.9722 |
|
INCL |
1.05 |
0.9499 |
|
EDU |
1.29 |
0.7781 |
|
LIT |
1.42 |
0.7026 |
|
EMPL |
1.27 |
0.7853 |
|
INFM |
1.03 |
0.9694 |
|
SOSEC |
1.13 |
0.8857 |
|
Mean VIF |
1.27 |
|
Note. VIF represents a variance inflation factor, and it represents the degree to which the inflation of the standard error could be caused by collinearity. Tolerance is 1⁄VIF , and it measures the extent of collinearity that a regression analysis can tolerate.
Source: Authors’ computation using collinandtest functions in Stata 14
4.5 Robustness and Consistency Checks
To ascertain whether the results generated using the Logit estimation technique are robust and consistent, the Probit model was employed and the results presented in Table 8. The results illustrate that account ownership, and access to financial institution, credit facility and mobile phone are inversely related to poverty at the 5 percent level of significance. A unit increase in the likelihood of account ownership, access to financial institution, credit facility and mobile phone reduces the log of the odds of poverty by 1.186, 1.082, 1.740, and 1.898, respectively. With regard to the marginal effect, the level of poverty reduces by 0.032 percent, 0.023 percent, 0.108 percent, and 0.386 percent, respectively. Furthermore, income level, literacy rate, employment and access to social security influence the level of poverty negatively. A unit increase in income level, literacy rate, employment, and access to social security reduces the log of the odds by 0.000027, 1.687, 1.848, and 1.51, respectively. Based on their marginal effects an increase in income level, literacy rate, employment and access to social security lead to a decrease in poverty level by 1.80E-09 percent, 0.105 percent, 0.196 percent, and 0.011 percent, respectively. These results illustrate that access to internet services, educational qualification and informal saving source are significantly related to poverty level.
Table 8
Estimation Results of Probit Regression Model
|
Regressor |
Coefficient |
Standard Error |
Z-Statistic |
Prob. |
dy⁄dx |
|
Constant |
2.772 |
0.534 |
5.20*** |
0.000 |
– |
|
ACCOWN |
-1.186 |
0.383 |
-3.10*** |
0.002 |
-0.00032 |
|
BANK |
-1.082 |
0.382 |
-2.84*** |
0.005 |
-0.00023 |
|
CREDIT |
-1.740 |
0.403 |
-4.32*** |
0.000 |
-0.00108 |
|
INFM |
0.346 |
0.347 |
1.00 |
0.319 |
0.00003 |
|
PHONE |
-1.898 |
0.352 |
-5.39*** |
0.000 |
-0.00386 |
|
INTERNET |
-0.310 |
0.363 |
-0.85 |
0.393 |
-0.00002 |
|
INCL |
-2.7E-05 |
1.37E-05 |
-1.96** |
0.050 |
-1.80E-09 |
|
EDU |
0.167 |
0.139 |
1.20 |
0.229 |
0.00001 |
|
LIT |
-1.687 |
0.495 |
-3.41*** |
0.001 |
-0.00105 |
|
EMPL |
-1.848 |
0.384 |
-4.81*** |
0.000 |
-0.00196 |
|
SOSEC |
-1.510 |
0.661 |
-2.29** |
0.022 |
-0.00011 |
|
No. of Observations |
624 |
|
|||
|
LRχ2 |
309.03 |
0.000 |
|||
|
Pseudo R2 |
0.7822 |
|
|||
Note. Asterisks (***), (**) and (*) indicate significance at the 1%, 5% and 10% level, respectively.
Source: Authors’ computation using Logit and mfx functions in Stata 14 based on data collected.
4.6 Results of Diagnostic Tests (Probit Regression Model)
The results of diagnostic tests in Table 9 reveal that the estimated model does not suffer from the problems of misspecification error and heteroscedasticity, and it is well specified.
Table 9
Results of Diagnostic Tests (Probit Regression Model)
|
Test |
Statistic |
Prob. |
|
_hat |
6.65 |
0.000 |
|
_hatsq |
0.48 |
0.633 |
|
χ2 HL |
1.020 |
0.998 |
|
χ2 HET |
3.23 |
0.987 |
Note. _hat and _hatsq denote linear predicted value and linear predicted value squared of the linktest. χ2 HET represents heteroscedasticity LM test statistics. χ2 HL is Hosmer-Lemeshow’s goodness-of-fit test statistic.
Source: Authors’ computation using linktest,lfit, Logit, predictandtest functions in Stata 14.
From the results reported, it is apparent that the estimation results of the Probit model are consistent with those generated using the Logit regression model, particularly with respect to signs and significance of the coefficients. Therefore, it can be concluded that the results generated are robust and consistent.
These empirical findings have some implications. For instance, the negative relationship between elements of financial inclusion (account ownership, access to bank and financial institutions, access to credit facilities and access to mobile phone) and the level of poverty is consistent with the outcomes of previous studies (Abiona & Koppensteiner, 2022; Aracil et al., 2022; Bakari et al., 2019; Coulibali & Yogo, 2016; Demir et al., 2022; Dogan et al., 2022; Jabir, 2015; Okoye et al., 2017; Omar & Inaba, 2020; Polloni-Silva et al., 2021; Sakanko et al., 2018). Thus, an improvement in financial inclusion reduces poverty by boosting the welfare of individuals, mobilising savings, facilitating the creation of small businesses, which in turn induces investment, employment, income generation.
In addition, the reducing effect of income level, literacy rate, employment and social security lends empirical support to the outcome of prior studies (Egunjobi, 2014; Mehmood & Sadiq, 2010; Muhammad & David, 2019; Ogbeide & Agu, 2015; Sakanko & David, 2018; Sakanko et al., 2018). This finding indicates that higher levels of income, employment and access to social security raise savings, consumption and demand for goods and services, which in turn leads to a decrease in the level of poverty. Also, the negative impact of literacy rate on poverty level is underlined by the sizable number of employment opportunities which request that individuals are able to read and write. Thus, high literacy rate improves the economic potentials of individuals, and consequently lowers poverty level.
5. Conclusion and Recommendations
This study investigates the impact of financial inclusion on poverty level using cross-sectional data randomly collected from 624 respondents across 224 towns and villages in 12 LGAs of Niger state in Nigeria. The results of estimation using both Logit and Probit regression methods illustrate that financial inclusion (measured by ownership of a bank account, access to financial institution, access to credit facility, and access to mobile phone) is significant and negatively related to the level of poverty in Niger state. In addition, income level, literacy rate, employment and access to social security play a significant role in reducing the level of poverty in the state.
Based on these empirical outcomes, this study recommends the following. First, it is important that the government (through the monetary authority) devise means to ensure that banks and other non-bank financial institutions broaden their coverage and soften their credit requirements to ensure that individuals, especially rural dwellers, have access to financial institutions and credit facilities. This will go a long way in enabling individuals to have easy access to financial products and services which hitherto were not available and/or accessible. Second, there is an urgent need to put in place strategies which will enhance individuals’ access to mobile phones, and boost coverage of telecommunication network and internet services, especially in the rural areas. This will enhance communication and facilitate financial transactions. Third, while it may be unrealistic to increase the income and provide jobs for the entire populace to reduce poverty, governments at all levels are encouraged to create an enabling environment for business to thrive. This will promote employment creation capacity of firms. Fourth, the government is advised to increase its spending on education to raise the literacy rate. This will in turn raise individuals’ ability in securing employment and earning income, leading to a reduction in poverty level. Lastly, local government authorities are advised to be actively involved in eradicating poverty, as adopting micro-level solutions would be much better than national macro policy.
References
Abimbola, A. Olokoyo, F. O., Babalola, O., & Farouk, E. (2018). Financial inclusion as a catalyst for poverty reduction in Nigeria. International Journal of Scientific Research and Management, 6(6), 481–490.
Abiona, O., & Koppensteiner, M. F. (2022). Financial inclusion, shocks, and poverty: Evidence from the expansion of mobile money in Tanzania. Journal of Human Resources, 57(2), 435–464.
Ajide, F. M. (2015). Financial inclusion and rural poverty reduction: Evidence from Nigeria. International Journal of Management Sciences and Humanities, 3(2), 1–20.
Alie, F. (2015). Economic growth and poverty reduction in Sierra Leone. International Journal of Economics, Commerce and Management, 3(2), 1–17.
Amin, M. (2005). Social Science Research Conception, Methodology and Analysis. Kampala: Makerer University Printery.
Aracil, E., Gómez-Bengoechea, G., & Moreno-de-Tejada, O. (2022). Institutional quality and the financial inclusion-poverty alleviation link: Empirical evidence across countries. Borsa Istanbul Review, 22(1), 179–188. doi:10.1016/j.bir.2021.03.006
Bakari, I. H., Donga, M., Idi, A., Hedima, J. E., Wilson, K., Babayo, H., & Ibrahim, Y. (2019). An examination of the impact of financial inclusion on poverty reduction: An empirical evidence from Sub-Saharan Africa. International Journal of Scientific and Research Publications, 9(1), 239–252. doi:10.29322/IJSRP.9.01.2019.p8532
Barik, R., & Pradhan, A. K. (2021). Does financial inclusion affect financial stability: Evidence from BRICS nations? Journal of Developing Areas, 55(1). doi:10.1353/jda.2021.0023
Bencivenga, V. R. & Bruce, D. S. (1991). Financial intermediation and endogenous growth. Review of Economic Studies, 58, 195-209.
Bhandari, A. K. (2009). Access to banking services and poverty reduction: A state-wise assessment in India. (IZA Discussion Papers, 4132).
Central Bank of Nigeria (2020). Central Bank of Nigeria Statistical Bulletin. 31.Abuja: CBN. Retrieved from https://statistics.cbn.gov/cbn-onlinestats/DataBrowser.aspx
Central Bank of Nigeria (2018). National Financial Inclusion Strategy (Revised). Abuja: CBN.
Coulibali, A., & Yogo, U. T. (2016). Access to Financial Services and Working Poverty in Developing Countries. New York: Marrauntck Cornec.
De Faria, R. Q., dos Santos, A. R. P., Amorim, D. J., Cantão, R. F., da Silva, E. A. A., & Sartori, M. M. P. (2020). Probit or logit? Which is the better model to predict the longevity of seeds?. Seed Science Research, 30(1), 49–58. doi:10.1017/s0960258520000136
Demir, A., Pesqué-Cela, V., Altunbas, Y., & Murinde, V. (2022). Fintech, financial inclusion and income inequality: A quantile regression approach. European Journal of Finance, 28(1), 86–107. doi:10.1080/1351847X.2020.1772335
Demirgüç-Kunt, A., Klapper, L., Singer, D., Ansar, D., & Hess, J. (2018). The Global Findex Database 2017: Measuring Financial Inclusion and the Fintech Revolution. Washington, DC: World Bank. doi:10.1596/978-1-4648-1259-0.
Djamaluddin, S. (2017). How to lower the poverty? Population control and increase of asset ownership. Significant: Journal Ilmu Ekonomi, 6(2), 267–288. doi:10.15408/sjie.v6i2.5096
Dogan, E., Madaleno, M., & Taskin, D. (2022). Financial inclusion and poverty: Evidence from Turkish household survey data. Applied Economics, 54(19), 2135–2147. doi:10.1080/00036846.2021.1985076
Edward, P. (2006). The ethical poverty line: A moral quantification of absolute poverty. Third World Quarterly, 27(2), 377–393. doi:10.1080/01436590500432739
Egunjobi, T. A. (2014). Poverty and unemployment paradox in Nigeria. IOSR Journal of Humanities and Social Science, 19(5), 106–116. doi:10.1007/s13398-014-0173-7.2
Enhancing Financial Innovation and Access (2019). Financial Inclusion in North East Nigeria. UkAid: EFInA. Retrieved from https://www.efina.org.ng/wp-content/uploads/2020/03/Financial-Inclusion-in-North-East-Nigeria.pdf
Eze, E. & Alugbuo, J. C. (2021). Financial inclusion and poverty reduction in Nigeria: A survey-based analysis. GSC Advanced Research and Reviews, 7(3), 75–84. doi:10.30574/gscarr.2021.7.3.0127
Gafaar, O. A. S., & Osinubi, T. S. (2005). Macroeconomic policies and pro-poor growth in Nigeria. Proceedings of the German Development Economics Conference, Kiel 2005 / Verein für Social politic, Research Committee Development Economics, 24.
Goldsmith, R. W. (1969). Financial Structure and Development. New Haven: Yale University Press.
Gündüz, N. & Fokoué, E. (2017). On the predictive properties of binary link functions. Communications Faculty of Sciences University of Ankara Series A1 Mathematics and Statistics, 66(1), 1-18. doi:10.1501/Commua1_0000000770
Gujarati, D. N. (2004). Basic Econometrics (4th ed.). New York: The McGraw−Hill Companies.
Hair, J. F. (2007). Research Method for Business. England: John Willy & Son Ltd.
Honohan, P. (2008). Cross-country variation in household access to financial services. Journal of Banking & Finance, 32(11), 2493–2500.
Hussaini, U., & Chibuzo, I. C. (2018). The effects of financial inclusion on poverty reduction: The moderating effects of microfinance. International Journal of Multidisciplinary Research and Development, 5(12), 188–198.
Jabir, M. I. (2015). Financial inclusion and poverty reduction in Sub-Saharan Africa. Unpublished thesis. College of Humanities University of Ghana, 49–69.
Kama, K. & Adigun, M. (2013). Financial inclusion in Nigeria: Issues and challenges. Central Bank of Nigeria Occasional Paper, 45.
Koomson, I., & Danquah, M. (2021). Financial inclusion and energy poverty: Empirical evidence from Ghana. Energy Economics, 94, 105085. doi:10.1016/j.eneco.2020.105085
Kumari, M. (2022). Financial inclusion and human development in India: An inter-state analysis. International Journal of Economics Development Research, 3(1), 1–12.
Lord, M. J. (2001). Macroeconomic policies for poverty reduction in Cambodia. Asian Development Bank (ADB). Retrieved from http://mpra.ub.uni-muenchen.de/41174/
Majumder, S., & Biswas, S. C. (2017). The role of education in poverty alleviation: Evidence from Bangladesh. Journal of Economics and Sustainable Development, 8(20), 151–160.
Mehmood, R., & Sadiq, S. (2010). The relationship between government expenditure and poverty: A cointegration analysis. Romanian Journal of Fiscal Policy, 1(1), 29–37.
McKinnon, R. I. (1973). Money and Capital in Economic Development. Washington, D. C.: Brookings Institute.
Muhammad, U. F., & David, J. (2019). Relationship between poverty and unemployment in Niger State. Signifikan: Jurnal Ilmu Ekonomi, 8(1), 71–78. doi:10.15408/sjie.v8i1.6725.
Nanda, K., & Kaur, M. (2016). Financial inclusion and human development: A cross-country evidence. Management and Labour Studies, 41(2), 127–153. doi:10.1177/0258042X16658734
National Bureau of Statistics (2012). Nigeria Poverty Profile 2010. Abuja: NBS.
Natianal Bureau of Statistics (2020). 2019 Poverty and Inequality in Nigeria: Executive Summary. Abuja, NBS.
Niger State Bureau of Statistics (2013). Census of Socio-economic Facilities in Political Wards Niger State. Minna: NSBS.
Nsiah, A, Y., Yusif, H., Tweneboah, G., Agyei, K. & Baidoo, S. T. (2021). The effect of financial inclusion on poverty reduction in Sub-Saharan Africa: Does threshold matter? Cogent Social Sciences, 7(1), 1–17. doi:10.1080/23311886.2021.1903138
Nunnally J, Bernstein L. (1994). Psychometric Theory. New York: McGraw-Hill Higher, INC.
Ogbeide, E. N. O., & Agu, D. O. (2015). Poverty and income inequality in Nigeria: Any causality? Asian Economic and Financial Review, 5(3), 439–452. doi:10.18488/journal.aefr/2015.5.3/102.3.439.452
Ogunsakin, S., & Fawehinmi, F. O. (2017). Financial inclusion as an effective policy tool of poverty alleviation: A case of Ekiti State. IOSR Journal of Economics and Finance, 8(4-2), 1–10. doi:10.9790/5933-0804020110
Okoye, L. U., Adetiloye, K. A., Erin, O., & Modebe, N. J. (2017). Financial inclusion: A panacea for balanced economic development. In 28th IBIMA Conference: Theme – 28th IBIMA Conference on Vision 2020: Innovation Management, Development Sustainability, and Competitive Economic Growth (pp. 4384–4394).
Omar, M. A., & Inaba, K. (2020). Does financial inclusion reduce poverty and income inequality in developing countries? A panel study analysis. Journal of Economic Structures, 9(37), 1–25. doi:10.1186/s40008-020-00214-4
Onaolapo, A. A., & Odetayo, T. A. (2012). Financial inclusion as tools for survival in globally competitive environment: Lessons for Nigerian microfinance banks. American Journal of Business and Management, 1(4), 241–247.
Onaolapo, A. R. (2015). Effects of financial inclusion on the economic growth of Nigeria (1982-2012). International Journal of Business and Management Review, 3(8), 11–28.
Polloni-Silva, E., da Costa, N., Moralles, H. F., & Sacomano Neto, M. (2021). Does financial inclusion diminish poverty and inequality? A panel data analysis for Latin American countries. Social Indicators Research, 158(3), 889–925. doi:10.1007/s11205-021-02730-7
Roemer, M., & Gugerty, M. K. (1997). Does economic growth reduce poverty? Harvard Institute for International Development. Retrieved from http://citeseerx.ist.psu.edu/viewdoc/download?doi=10.1.1.525.7199&rep=rep1&type=pdf
Sakanko, M.A., Abu, N., & David, J. (2019). Financial inclusion: A panacea for national development in Nigeria. In Proceedings of the 2nd National Conference of the Faculty of Social Sciences, Federal University Lafia (pp. 501–514). Lafia, Nigeria: Faculty of Social Sciences, Federal University Lafia.
Sakanko, M. A., Audu, A. U., Lawal, M. C., & Onimisi, A. M. (2018). Analysis of the impact of financial inclusion on poverty reduction in Minna Niger State, Nigeria. Abuja Journal of Economics and Allied Field, 8(4), 80–90.
Sakanko, M. A. & David, J. (2018). The role of religion in poverty alleviation: Evidence from Nigeria. UMYUK Journal of Economics and Development, 1(2), 128–142.
Sakanko, M. A., David, J., & Onimisi, A. M. (2020). Advancing inclusive growth in Nigeria: The role of financial inclusion in poverty, inequality, household expenditure, and unemployment. Indonesian Journal of Islamic Economics Research, 2(2), 70–84. doi:10.18326/ijier.v2i2.3914
Schmied, J. & Marr, A. (2016). Financial inclusion and poverty: The case of Peru. Regional and Sectoral Studies, 16(2), 76–84.
Shaw, E. (1973). Financial Deepening in Economic Development. New York: Oxford University Press.
Slovin, E. (1960). Slovin’s formula for sampling technique. Retrieved on the 4th October, 2022.
Smith, H. W. (1991). Strategies of Social Research. Orlando: Rinehart and Winston.
Thanh, T. H. T. & Thu, L. T. (2021). The impact of financial inclusion on poverty reduction. Asian Journal of Law and Economics 12(1), 95–119. doi:10.1515/ajle-2020-0055
Appendix
Questionnaire
Section A: Personal Data
Instruction: Please fill in the blank spaces and tick (√) in the box to indicate your choice
1. Please specify whether your area is rural or urban: Rural (...) Urban (...)
2. Gender: Male (...) Female (...)
3. Age group: 18–30 (...) 31–50 (...) 51–60 (...) 61 and above (...)
4. Marital Status: Single (...) Married (...) Divorced/Separated (...) Widowed (...)
5. Have you ever gone through a formal education? Yes (...) No (...)
6. If no, please indicate the reason for not attending a school: Too young (...) Disability (...) Parents are opposed to schooling (...) Too far away/No school nearby (...) Too expensive (...) Working (...) Lack of money (...) Death of parent(s) (...) Separation of parents (...) Not interested (...) Parents do not think it is important (...) Other, please specify __________
7. Kindly identify your highest educational qualification attained. None (...) First School Leaving Certificate (...) Vocational/Commercial certificate (...) Secondary School Certificate (...) NCE/OND/Nursing ( ) B.A./B.Sc./HND ( ) Other, please specify __________
8. Income Level: Below US$20 (...) US$20 – US$40 (...) US$41– US$80 (...) US$81 – US$160 (...) US$161– US$200 (...) Above US$200 (...)
9. On average, for the past 6 months, how much do you spend daily? Less than $0.50 (...) $0.51-$0.75 (...) $0.76-$1 (...) $1.1-$1.90 (...) Above $1.90
Section B: Financial Inclusion Status
Instruction: Please fill in the blank spaces and tick (√) in the box to indicate your choice.
1. Do you have a bank account in any financial institution (bank, MFB, co-operative)? Yes (...) No (...) Can’t say (...)
2. If yes, what was the reason for opening it? Loan (...) Salary (...) Savings/Deposit (...) Other, please specify ___________
3. If no, why do you choose not to have an account? Distance of financial institutions (...) Cost of financial services (...) Absence of necessary document (...) Lack of trust in financial institutions (...) Because of religion/culture (...) Lack of enough money to deposit in financial institutions (...) Because someone else in the family already have an account (...) Other, please specify ______________
4. Did you search for information from a range of sources before getting the bank(s) account(s)? Yes (...) No (...) Can’t say (...)
5. In the last 12 months have you used any commercial bank(s), cooperative, savings association or micro-finance institution to save money? Yes (...) No (...) Can’t say (...)
6. Do you have any financial institution/agent bank in your community? Yes (...) No (...) Can’t say (...)
7. In the last 12 months, have you or anyone else in the household borrowed money or applied for or received a loan from sources such as banks, cooperative societies, savings associations, micro-finance institutions, money lenders etc.? Yes (...) No (...) Can’t say (...)
8. What is the type of the financial institution(s) from which you or anyone else in your household attempted to borrow money or applied for a loan over the past 12 months? Cooperative Society (...) Savings Association (...) Micro Finance (...) Bank (...) Adashi/Esusu/Ajo (...) Friends & relatives (...) Money lenders (...) Hire Purchase (...) Other, please specify ______________
9. What was the main reason for applying for the loan? Purchase of land (...) Home purchase/Construction (...) Other household consumption (...) Health expenses (...) Purchase inputs for food crop (...) Purchase inputs for cash crop (...) Purchase livestock (...) Business start-up capital (...) Non-farm business costs (...) Ceremonies (...) Education (...) Motor vehicle purchase (...) Other, please specify __________________
10. Did your household have a need of a loan in the last 12 months? Yes (...) No (...) Can’t say (...)
11. Do you have a mobile phone? Yes (...) No (...)
12. Do you have access to internet connection or browse with your phone? Yes (...) No (...)
Section C: Determinants of Financial Inclusion
Instruction: Please fill in the blank spaces and tick (√) in the box to indicate your choice
1. Can you read and write in any language (literacy)? Yes (...) No (...) Can’t say (...)
2. Did you use any informal savings groups (adashi/esusu/ajo) to save money in the past 12 months? Yes (...) No (...) Can’t say (...)
3. During the past 7 days, have you worked for someone who is not a member of your household, for example, an enterprise, company, the government or any other individual for payment in cash or in-kind? Yes (...) No (...)
4. Do you have a job, business, or other economic or farming/ livestock/ fishing activity? Yes (...)No (...) Can’t say (...)
5. What sector is your main activity? Agriculture (...) Personal services (...) Education (...) Health (...) Public Administration (...) Mining (...) Manufacturing (...) Electricity/Water/Gas/Waste (...) Construction (...) Transportation (...) Buying and Selling (...) Financial/Insurance/Real estate (...) Other, please specify ________________
6. In the last 12 months, has any member of your household received any assistance from any institution such as the government, international organisations, religious bodies in a form of: cash; food, including school feeding; other in-kind, such as animals; and scholarship? Yes (...) No (...) Can’t say (...)