Organizations and Markets in Emerging Economies ISSN 2029-4581 eISSN 2345-0037
2021, vol. 12, no. 2(24), pp. 26–49 DOI: https://doi.org/10.15388/omee.2022.13.69
Push or Pull: What Drives Emigration from Lithuania?
Remigijus Kavalnis (corresponding author)
Vilnius University, Lithuania
r.kavalnis@gmail.com
https://orcid.org/0000-0001-5114-7318
Gindrute Kasnauskiene
Vilnius University, Lithuania
gindrute.kasnauskiene@evaf.vu.lt
https://orcid.org/0000-0003-0741-6538
Abstract. This article investigates the main economic and non-economic determinants of population emigration from Lithuania. Our study offers a new approach for modelling the push and pull factors considering the push–pull link. We construct the relative variables and deploy mixed models for the macro data of Lithuania and 24 European destinations over 2010–2019. Our findings reveal that such economic variables as relative economic welfare, unemployment and income inequality are the key push–pull factors. The study results indicate that changes in relative welfare have the highest power to change Lithuanian emigration with the main impact recorded the same year, while changes in relative income inequality and unemployment affect fewer emigrants, and it takes one year for the effect to materialise. The obtained higher importance of relative welfare compared to the average wage suggests that the goods and services provided by the state play a role in the personal cost–benefit calculation of prospective emigrants. This study addresses the research gap on the quantitative push–pull factor evaluation, the timing of their impact, connectivity of the push–pull factors and structural changes, providing a foundation for future research on the root causes of emigration.
Keywords: population emigration, push and pull factors, panel data regression, impact over time
Received: 29/1/2022. Accepted: 14/4/2022
Copyright © 2022 Remigijus Kavalnis, Gindrute Kasnauskiene. Published by Vilnius University Press. This is an Open Access article distributed under the terms of the Creative Commons Attribution Licence, which permits unrestricted use, distribution, and reproduction in any medium, provided the original author and source are credited.
Introduction
Since the start of labour migration at around 1995 (Sipavičienė & Stankūnienė, 2013), over 0.92 million people have decided to emigrate to a foreign country (Statistics Lithuania, 2021). Considering the current population of 2.79 million, emigration of such scale has earned Lithuania the name of “emigrants’ country” (Kumpikaitė-Valiūnienė & Žičkutė, 2017). With no comparable inflows of immigrants, emigration has decreased the Lithuanian population (OECD, 2018). Hence, there is a clear need for investigation of the forces leading to out-migration of Lithuanian population.
Currently, the investigation of the main push and pull factors was mostly based on surveys of emigrants, demanding a quantitative evaluation using macro data. Moreover, the push and pull factors were often analysed separately, with little to no analysis of their impact on emigration over time or respect of the structural changes affecting emigration.
By using mixed models, this article aims to validate the existence of the relevant push and pull factors deploying the newest macro level data of Lithuania and 24 European destinations, which is done accounting for the jump in emigration declaration in 2010 and the impact of the Brexit vote. By considering the lags of both economic and non-economic push–pull factors, this article offers new knowledge on their impact on emigration over time. Finally, the use of relative variables makes it possible to simultaneously account for both the pull and push side of information, expand the sample size and attain more reliable coefficient estimates.
1. Theoretical Framework
The early decision-making theory proposed by Everett S. Lee is used to investigate the issue of emigration of Lithuanian population (Lee, 1966). This framework views human mobility as the result of specific factors that either repel an individual from continued stay in the native country (push factors) or that attract the individual to move to the “new” country (pull factors). This section discusses the existing evidence that has been consistently identified in the literature as relevant in influencing such mobility patterns. The push and pull factors are discussed side by side, which reveals their relatedness.
1.1 Economic push and pull factors
The economic push factors such as low wage, income inequality and unemployment level are found to be the most important factors for Lithuanians to leave the native country (Kumpikaitė-Valiūnienė et al., 2021; Kumpikaitė-Valiūnienė & Žičkutė, 2017). In addition, Kumpikaite & Zickute (2013) found that higher unemployment and income inequality in Lithuania are both related to higher emigration. The analysis of Damulienė (2013) also directs to high unemployment in Lithuania as the main push factor. In fact, it is estimated that the unemployed people have 1.502 times higher likelihood of emigration compared to those who are employed (Klüsener et al., 2015). For those who plan to emigrate, low wages, unemployment and low living conditions in Lithuania were identified as the chief push factors (Streimikiene et al., 2016). Although related to the average wage, the level of economic development finds itself among the main push factors for emigrants both willing and not willing to return (Kumpikaitė-Valiūnienė et al., 2021). These factors are supported by the panel gravity model results for migration flows between the Central, Eastern, and South-Eastern Europe (CESEE) and the OECD countries, which suggests that differences in income per capita and unemployment rates are the key determinants of both skilled and unskilled migration (Atoyan et al., 2016). Additionally, the study considers economic condition more of a pull while unemployment— both a push and a pull factor. Considering Lithuanians with higher skills, the main push factor group was found to be the socio-economic status, where job income is the most significant factor, and inadequate material conditions are in the 3rd position (Kazlauskienė & Rinkevičius, 2006). Moreover, as the random-effects model results for the New European Member (NMS) suggest, higher long term unemployment rate and higher income inequality in the origin countries lead to lower net migration (higher emigration) (Cimpoeru, 2020).
One more factor that can encourage emigration is the tax burden in Lithuania. For instance, it is identified in the 7th position out of 26 both economic and non-economic factors for both groups of emigrants that are willing and unwilling to return (Kumpikaitė-Valiūnienė et al., 2021). The Tax Freedom Day (the day at which an average Lithuanian has earned enough to cover their tax obligations for the whole year) is also found to have an emigration-increasing effect (Kumpikaite & Zickute, 2013). By profession, the burden of the tax system is comparatively more important for the plant, machine operators and assemblers, and acts as the most important push factor for Lithuanians who are self-employed (Kumpikaitė-Valiūnienė & Žičkutė, 2017). In comparison with its main emigrant destination countries during 2000–2019, the average tax wedge, a measure of the effective tax burden on labour, in Lithuania was indeed higher than that of Norway, the United Kingdom (UK) and Ireland, being lower only compared to Germany (OECD, 2021). Apart from the tax wedge, social security system is found to be a rather important push factor (Kumpikaitė-Valiūnienė et al., 2021), while low social protection and deficient demand for labour are also outlined as candidates for the primary push factors (Hazans, 2016).
Considering the pull-side factors, a mirror-like image can be observed. Kumpikaitė-Valiūnienė and Žičkutė (2017) found that higher wages and better employment opportunities are the key pull factors for Lithuanians. The professional attraction is found to be the main pull factor group, in which the most strongly supported component is wage (Kazlauskienė & Rinkevičius, 2006). Moreover, the panel gravity model results suggest that an increase in living standards at destination country by 1% increases emigration by 2.2%, while changes in unemployment rates affect emigration from both the push and pull sides (Draženović et al., 2018). Finally, around 3–4 times higher income (accounting for the purchasing power), more generous social security and superior employment opportunities are said to be crucial emigration pull factors for Lithuanians (Sipavičienė & Stankūnienė, 2013; OECD, 2018).
1.2 Non-economic Push and Pull Factors
In addition to the economic aspects, there are several non-economic factors that influence the decision to emigrate. They are reviewed starting with the push factors.
It is generally believed that non-economic factors could be more important for the skilled individuals that typically earn more and are less likely to face or be motivated by economic hardship compared to the low-skilled segment (Cieslick, 2011). It is suggested that bad work conditions with insufficient equipment is an important push factor for the more educated Lithuanians (Kazlauskienė & Rinkevičius, 2006). This is supported by the binary logistic analysis results, which show that the perceived low quality of working life is one of the two main statistically significant push factors and could be linked to psychological discomfort at work and lack of career opportunities (Bryer et al., 2020). Indeed, only around a quarter of Lithuanians agree that their job has good opportunities for carrier advancement compared to over 40% share for Latvia and Estonia and almost 40% for the European Union (EU) (OECD, 2018).
Authors also point to the importance of limited self-realisation opportunities in Lithuania, including professional realisation. Kazlauskienė and Rinkevičius (2006) found that limited options for professional realisation are among the key push factors for the well-educated. Additionally, Rakauskienė and Ranceva (2013) identified limited possibilities for self-realisation, interesting work and self-expression in Lithuania as important push factors, with the latter being particularly relevant for female emigration. The lower professional self-realisation in Lithuania could be in part explained by the size of Lithuanian economy, as smaller labour markets can offer less diversity in terms of employment opportunities compared to the main destination countries. In addition, the relatively low capital assets of Lithuanian firms may suggest less innovative and productive means of work, which can result in less exiting jobs (OECD, 2018).
Political corruption is also a factor that pushes Lithuanians to emigration. By priority from 26 both economic and non-economic push factors for emigrants not willing and willing to return respectively, political corruption was in the 5th position for both groups (Kumpikaitė-Valiūnienė et al., 2021). It is found to be an important push factor for the emigrants aged 30 and older (Kumpikaitė-Valiūnienė & Žičkutė, 2017). The perceived corruption was indeed lower in the main destination countries in 2020 (Transparency International, 2021). Lithuania also had the below-the-OECD-average corruption control in 2020 (OECD, 2020).
Considering the pull factors, they seem to be closely related to the push-side ones. It is found that over 30% of emigrants identify higher possibilities to develop and realise oneself as pull factors (Kumpikaitė-Valiūnienė & Žičkutė, 2017). In addition, Streimikiene et al. (2016) found that more than a quarter of those who plan to emigrate indicate better prospects of self-realisation as an attracting factor. This resonates with the results for the CESEE countries, where more generous social benefits in receiving countries were found to be the most important pull factor for the unskilled workers but had virtually no effect for the skilled workers (Atoyan et al., 2016).
Moreover, the better means to do the job and better possibility to improve one’s professional skills are found to be the key non-economic pull factors for the well-educated, being positively and significantly correlated with their education level (Kazlauskienė & Rinkevičius, 2006). The relatively poor professional realisation in Lithuania is supported by the results of Streimikiene et al. (2016), who identified better carrier opportunities abroad as an important pull factor. The orientation of emigrants towards higher self-realisation opportunities is also supported by the findings of Kumpikaitė-Valiūnienė et al. (2021).
Hence, the same factors can act from both the push and pull sides, as reduced attractiveness of the origin country is closely related to the increased attractiveness of the destination. The empirical investigation of the key drivers of emigration uses this idea of the push and pull factor connectivity, which is further discussed in the following sections.
2. Research Methodology
2.1 Methods
The aim of this empirical research is to determine the main push and pull factors for emigration from Lithuania. R software was used to achieve the results.
Based on the reviewed studies, a common method for push–pull factor analysis is gathering survey-type data and using association analysis to obtain the results (see Appendix A).
Although this approach provides rich and nuanced information about the subject under investigation, the obtained results can provide no interpretation in the sense of elasticities nor account for the effects of other important factors, which is possible using regression analysis.
Having access to panel data of 25 European countries, this study uses mixed models for investigation of the most relevant push and pull factors. Among other variants, the two main types of panel data regressions are fixed-effects (FE) and random-effects (RE), which are used in this study. The use of individual-specific effects estimation is supported by the fact that the mean and variance of log emigration is different depending on the country as well as the F-test for individual effects and the Breusch-Pagan test results.
The FE model estimates regression lines for each cross-sectional unit, which are of the same slope but with individual-specific intercepts. The functional form of the FE regression model can be expressed as follows:
 (1)
(1)
Here i represents a cross-sectional unit, t – time, y – dependant variable, α – intercept, u – cross-sectional unit specific fixed-effect, X’ – regressor, v – independent and identically distributed (i.i.d.) error term. The advantage of using the FE model is that it allows individual specific effects to correlate with predictor variables with no need to model their correlation patterns. However, there are some limitations, such as a risk of severe multicollinearity, country-specific heteroskedasticity or autocorrelation (Kavalnis, 2020).
The alternative is the RE model, which assumes that individual effects are not correlated with predictor variables, and error variances are randomly distributed across cross-sectional units. Compared to the FE model, here the differences between cross-sectional units are created through their cross-sectional unit specific error terms (Kavalnis, 2020). The functional form of the RE model, where u denotes the country specific random effect, is as follows:
 (2)
(2)
One advantage of the RE model is that it makes it possible to derive efficient estimators that make use of both within and between (group) variation. Moreover, it reduces the number of parameters that need to be estimated, increasing degrees of freedom. However, if cross-sectional unit specific effect is correlated with explanatory variables, the estimates of this model become inconsistent.
In addition, as Section 1 suggests, the same factors can act as push and pull factors, suggesting their connectedness. It is reasonable to suspect that it is the relative levels of variables (e. g., wage, unemployment or income inequality) that matter for the potential emigrants when considering emigration (e. g., Ackers et al., 2007). Consequentially, the relative variables were created according to the following formula:
 . (3)
. (3)
Such variables reflect both the pull and push side of information using macro-level data. In addition, the research design allows for consideration of the less favourable destinations, increasing the sample size. For example, if the relative wage for a particular country increased from 0.8 to 0.9, this would retain the same direction of the relationship with emigration as for a country with corresponding values of 1.1 and 1.2. The mixed models are commonly used and can be considered an alternative to gravity models for emigration (e. g., Draženović et al., 2018). However, unlike in the gravity model, which is often based on immigration statistics of selected receiving countries, we use emigration data from a single country. This ensures greater comparability of migration data. In addition, the distance between Lithuania and destination countries, a crucial factor in gravitational models, was found to be one of the least influential pull factors for Lithuanians (Kumpikaitė-Valiūnienė & Žičkutė, 2017).
In the following sections, once the attractiveness of Lithuania in terms of the relative variables is reviewed, the impact of the push-pull factors over time is analysed using individual FE equations. Having outlined the most important factors, the RE model is created for assessment of their impact on emigration in terms of elasticities.
2.2 Data and Research Hypotheses
Based on the reviewed literature, the push-pull factors that are likely to determine the decision to emigrate were chosen.
Data for predictors were gathered from the Eurostat database, R_CC — from the World Bank, while data for the outcome variable comes from the Statistics Lithuanian database. All variables are observed annually for the period of 2010–2019 for a panel of Lithuania and 24 European countries. The final model is estimated on an unbalanced sample of 239 observations (one observation was used for lag creation). The selected push–pull factors, their descriptions with codes as well as the respective hypotheses are summarised in Table 1.
Table 1
Hypothesized Relationships between Push–Pull Factors and Emigration
|
Factor |
Base variable |
Expected |
Author endorsement |
|
Relative average wage (R_AW, R_AW1) |
Annual net earnings of a single person without children earning 100% of the average earning at Purchasing Power Standards (PPS). For R_AW1 – 50% [earn_nt_net] |
H1: Increases (+) |
(Atoyan et al., 2016) (Draženović et al., 2018) (Kumpikaitė-Valiūnienė et al., 2021) (Kumpikaitė-Valiūnienė & Žičkutė, 2017) |
|
Relative welfare of consumers (R_AIC) |
Actual individual consumption (AIC) per capita at current prices in PPS [nama_10_pc] |
H1a: Increases (+) |
(Streimikiene et al., 2016) (Sipavičienė & Stankūnienė, 2013) (Kazlauskienė & Rinkevičius, 2006) |
|
Relative unemployment (R_U) |
Unemployment rate for males and females aged 20-64, percent of active population [une_rt_a] |
H2: Decreases (-) |
(Atoyan et al., 2016) (Cimpoeru, 2020) (Draženović et al., 2018) (Hazans, 2016) (Klüsener et al., 2015) (Kumpikaitė-Valiūnienė & Žičkutė, 2017) (Kumpikaitė-Valiūnienė et al., 2021) (Sipavičienė & Stankūnienė, 2013) (Kumpikaite & Zickute, 2013) (Streimikiene et al., 2016) (Damulienė, 2013) |
|
Relative income inequality (R_S80S20) |
Income inequality for males and females, measured as a ratio between incomes of the top 20% and the bottom 20% quintiles [ilc_pns4] |
H3: Decreases (-) |
(Cimpoeru, 2020) (Kumpikaitė-Valiūnienė & Žičkutė, 2017) (Kumpikaite & Zickute, 2013) (Kumpikaitė-Valiūnienė et al., 2021)
|
|
Relative tax burden (R_TW) |
Tax wedge on labour costs for single persons without children earning 67% of the average wage, measured in percent [earn_nt_taxwedge] |
H4: Decreases (-) |
(Kumpikaitė-Valiūnienė & Žičkutė, 2017) (Kumpikaite & Zickute, 2013) (Kumpikaitė-Valiūnienė et al., 2021) |
|
Relative social protection (R_SB) |
Expenditure on social protection as percent of GDP at current prices [TPS00098] |
H5: Increases (+) |
(Atoyan et al., 2016) (Hazans, 2016) (Kumpikaitė-Valiūnienė et al., 2021) (Sipavičienė & Stankūnienė, 2013) |
|
Relative professional self-realisation opportunities (R_Highr) |
Transition to the same or higher qualification level in terms of employment status and pay compared to the previous year for the whole population, measured in percent [ilc_lvhl35] |
H6: Increases (+) |
(Streimikiene et al., 2016) (Kumpikaitė-Valiūnienė & Žičkutė, 2017) (Rakauskienė & Ranceva, 2013) (Kazlauskienė & Rinkevičius, 2006) |
|
Relative work conditions (R_Week) |
Work on weekends, by all occupations, percentage from all employees aged 20-64 [lfsa_qoe_3b3] |
H7: Decreases (-) |
(Bryer et al., 2020) (Kazlauskienė & Rinkevičius, 2006) |
|
Relative control of corruption (R_CC) |
Perceived control of corruption in units of a standard normal distribution (higher values – higher control and less corruption) [CC.EST from WGI by World Bank] |
H8: Increases (-) |
(Kumpikaitė-Valiūnienė et al., 2021) (Kumpikaitė-Valiūnienė & Žičkutė, 2017) |
The R_AW1, which is analogous to R_AW, only for individuals earning 50% of the average earning, is considered because the majority of Lithuanian-born workers in the EU countries worked in elementary occupations in 2016 (OECD, 2018), and the majority of emigrants-to-be were long term inactive before emigration (Statistics Lithuania, 2008; 2010; 2013; 2014; 2015).
Although closely linked with the average wage and the GDP per capita, the AIC measures the goods and services actually consumed by households, encompassing consumer goods and services purchased directly by households as well as services provided by non-profit institutions and the government for individual consumption (e. g., health and education services) (Eurostat, 2017). These “free” services are not fully reflected by the often-used average wage indicator. Hence, the R_AIC, which captures the relative welfare of consumers among countries, is considered alongside the R_AW.
Considering the R_Week, work on weekends is often done at the cost of ones’ family and personal life, and workers typically prefer not to engage in this kind of activity. It can be argued that in a society where such practice is more widespread, it is more likely that violation of some other rights of workers is regarded as socially acceptable. Hence, this regressor is used as a proxy for the discussed non-economic factor of unsatisfactory work conditions or low quality of working life.
Regarding R_CC, together with Corruption Perceptions Index (CPI), the corruption control is a commonly used indicator of perceived corruption (Rohwer, 2009). The CPI was not selected, as the change in methodology in 2012 made the values of the years before and after the change non-comparable.
Moreover, it is observed that a somewhat artificial jump in emigration numbers occurred in 2010 due to increased emigration declaration with intent of avoiding the health insurance payments, which was made mandatory for all residents of Lithuania by a new law (e. g., Kumpikaite-Valiuniene, 2019). In addition, the visual examination of countries revealed that the jump in emigration has taken place in most countries following the Brexit vote on 23 June 2016 in the most popular destination, which could be explained by the more risk-averse individuals choosing other countries (see Figure 4). Consequentially, a Brexit vote dummy was introduced for years 2016–2017 and dummy2010 – for year 2010.
Such variables as social protection benefit expenditure per capita, healthy life expectancy based on self-perceived health and long-term unemployment were also considered. Although the former two were highly correlated with the R_AW or R_AIC, while the latter one with R_U, they were not explored further.
In the further analysis, all inferences are drawn using the 0.05 significance level unless indicated otherwise. HAC robust standard errors by Arellano were used to obtain p-values of coefficient estimates. Moreover, all inferences about the relationships between variables are formed in ceteris paribus terms.
3. Results
3.1 Push–Pull Factors by Destination
Firstly, the data of the European countries is reviewed to see if there are any tendencies and how Lithuania appears in their context. As confirmed by the results of both P test by Choi and Choi’s modified P Unit-Root test for large N, all variables (as well as their logs) are stationary. An overview of the initial data is presented in Figure 1.
Figure 1
Data for Nine Predictors, 2010–2019
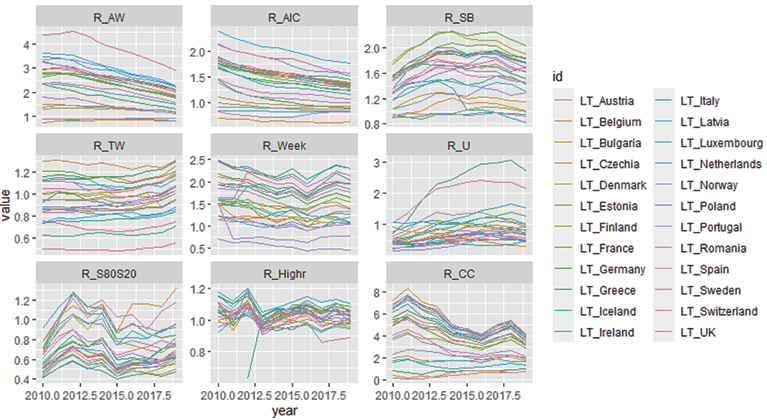
Source: Authors’ calculations based on the data provided by Statistics Lithuania.
Note. A constant of 1 was added to R_CC values to ensure positive values for potential log transformation.
The graph suggests that the wage and living standards are considerably higher in the majority of European countries, but the large discrepancies in relative wage become around two times smaller considering AIC. This suggests that once the actual welfare of consumers is considered, Lithuania is closer to other developed European countries than could appear looking solely at the relative wage. In addition, a convergence between countries in terms of R_AW or R_AIC can be observed, which, if continued, may hint at increasingly fewer incentives to emigrate related to better living standards in the upcoming years. Staying in Lithuania is not attractive in terms of income inequality, unemployment rate, tax burden, social protection expenditure and corruption control. The situation is better in terms of work conditions and possibilities of professional self-realisation.
3.2 Push–Pull Factors over Time
After examination of predictor relationships with l.EM, they were deemed suitable for linear approximation. The linearity of factors R_U and R_S80S20 improved in a log form with potential improvements for the wage-related measures. The log form also improved distributions of these variables (particularly for R_U and R_S80S20), which were positively skewed. In the pre-screening stage, multiple single predictor FE equations (also including the dummy2010 and Brexit) were estimated for variables as well as their lags. The most significant ones (those with p-value <0.1) are presented in Figure 2.
Figure 2
Impact of Push–Pull Factors on Emigration over Time

Source: Authors’ calculations based on the data provided by Statistics Lithuania.
Note: . represents p value < 0.1, * signifies p value < 0.05, ** represents p value < 0.01, *** represents p value < 0.001.
The analysis revealed that from the highly collinear income-related factors, R_AW was a slightly better predictor than R_AW1, while R_AIC outperformed R_AW. Positive changes in these factors were found to have a rather fast positive impact on emigration in t and t+1 years. The fourth lag of R_AW and R_CC were deemed too distant. For income inequality, the first lag of l.R_S80S20 was of the expected sign, suggesting that increases in relative income inequality have a negative impact on emigration after 1 year. Of the push–pull factors, changes in l.R_U had the most prolonged impact on emigration of the anticipated direction, which lasts for four years. The negative impact of R_Highr and R_SB on l.EM stood against the hypothesised direction. The impact of R_TW and R_Week was not statistically significant, suggesting that these factors play a lesser role in explaining emigration.
3.3 Model for Emigration
To create a model for emigration, higher focus was put on variables that showed economically sound and statistically significant relationships. In case several forms or lags of variables had a statistically significant effect, only the most important variable version was included to avoid severe multicollinearity. To get a sense of connections between variables, pairwise correlation matrix was computed (see Figure 3).
Figure 3
Pearson Correlation for Selected Pairs of Variables
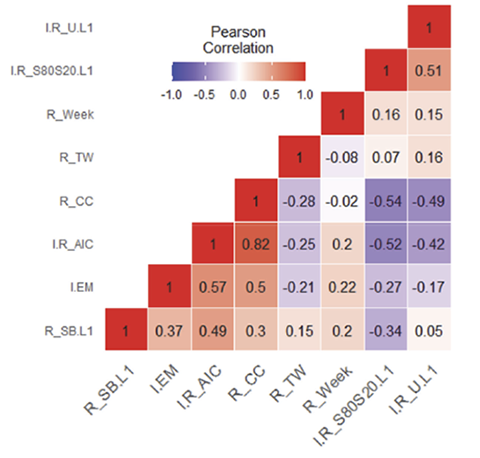
Source: Authors’ calculations based on the data provided by Statistics Lithuania.
The collinearity starts to distort estimation when pairwise correlations exceed 0.7 (Dormann et al., 2013). Evidently, higher relative welfare of consumers is closely related to higher perceived corruption control. As these two carry similar information, the use of the more significant l.R_AIC variable was preferred. There were no such correlations among other selected predictors. Nonetheless, correlations among the variables l.R_AIC, l.R_S80S20.L1 and l.R_U.L1 were rather high. Consequentially, the possibility of severe multicollinearity was inspected via estimation of multiple FE equations including different combinations of factors and cross-checking the sign, size and significance of coefficient estimates with the single factor equations. It was found that the same three factors (l.R_AIC, l.R_S80S20.L1 and l.R_U.L1) were the most stable compared to other factors. AIC, BIC, Adj. R-Squared were further considered for selection of the best model. Consequentially, a model equation containing all three predictors was chosen as the most appropriate. The unrejected H0 of the Houseman test revealed that from the mixed models, the RE alternative is more efficient. Hence, the RE model was selected. In the final model no observation was a high leverage point judging by Cook’s distance. Moreover, the coefficient estimates of the included predictors were of expected signs and sizes, the model was not sensitive to adding insignificant variables or removing several observations, while all VIF values were below the strict <5 threshold, indicating absence of severe multicollinearity. The fitted vs. actual plot for the final RE model is presented in Figure 4.
Figure 4
The Fitted vs. Actual Plot for the Final Random-Effects Model
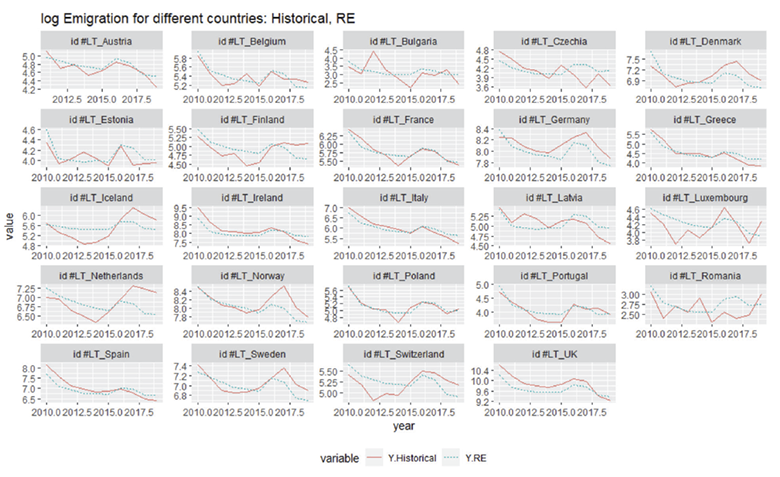
Source: Authors’ calculations based on the data provided by Statistics Lithuania.
The RE model captures the general dynamics of emigration well for most of the countries in the panel, including the most popular destinations. Based on the Adj. R-squared, variation in predictors explains 42% of variation in log emigration.
3.4 Main Findings
Summing up the results, they are contrasted with the initial hypotheses in Table 2.
Table 2
Study Findings vs. Hypothesised Relationships
|
Factor |
Expected relationship |
Obtained result |
Conclusion |
|
Relative average wage (R_AW, R_AW1) |
H1: Increases (+) |
Increases (+) |
Not rejected |
|
Relative welfare of consumers (R_AIC) |
H1a: Increases (+) |
Increases (+) |
Not rejected |
|
Relative unemployment (R_U) |
H2: Decreases (-) |
Decreases (-) |
Not rejected |
|
Relative income inequality (R_S80S20) |
H3: Decreases (-) |
Decreases (-) |
Not rejected |
|
Relative tax burden (R_TW) |
H4: Decreases (-) |
No impact |
Rejected |
|
Relative social protection (R_SB) |
H5: Increases (+) |
Decreases (-)* |
Rejected |
|
Relative professional self-realisation opportunities (R_Highr) |
H6: Increases (+) |
Decreases (-) |
Rejected |
|
Relative work conditions (R_Week) |
H7: Decreases (-) |
No impact |
Rejected |
|
Relative control of corruption (R_CC) |
H8: Increases (-) |
Increases (+) |
Not rejected
|
Source: Authors’ calculations based on the data provided by Statistics Lithuania.
Note. * CI =90%.
From the analysed economic and non-economic factors, it was found that the main push–pull factors for emigration are the actual individual consumption, unemployment rate and income inequality. Factors related to the average wage were found to be important but inferior in explaining emigration to the AIC per capita, with which they highly correlate. Hence, the study results support hypotheses H1, H1a, H2 and H3. Economic factors such as social protection expenditure and tax burden or non-economic factors for professional self-realisation and good working conditions were found to be less suitable in explaining emigration. Nonetheless, judging from the single-factor equations, H4, H5, H6 and H7 can be rejected. By the impact direction, the obtained result for relative control of corruption favours Hypothesis 8.
The final RE model estimates for the main factors used for interpolation are shown in Table 3.
Table 3
Final RE Model Results
|
|
Estimate |
Std.Error |
Zvalue |
Pr(>|z|) |
|
(Intercept) |
+5.19 +0.50 +0.27 -0.21 +1.04 -0.18 |
0.31 0.08 0.03 0.11 0.52 0.08 |
16.82 5.94 7.9 -2.01 1.99 -2.31 |
*** *** *** * * * |
Source: Authors’ calculations based on the data provided by Statistics Lithuania.
Note. * = p value < 0.05, ** = p value < 0.01, *** = p value < 0.001.
Interpreted from the perspective of Lithuania, the model results suggest that:
• A 10 % increase in consumer welfare in Lithuania relative to destination countries this year decreases Lithuanian emigration by 10.4 % the same year (p-value < 0.05).
• A 10 % decrease in income inequality in Lithuania relative to destination countries this year decreases Lithuanian emigration by 2.1 % next year (p-value < 0.05).
• A 10 % decrease in unemployment rate in Lithuania relative to destination countries this year decreases Lithuanian emigration by 1.8 % next year (p-value < 0.05).
• Compared to other nine years discussed, emigration increased by 65 % in the year 2010, following changes in law regarding health insurance payments (p-value < 0.001).
• Compared to other eight years discussed, emigration increased by 31 % in the years 2016–2017, following the Brexit vote (p-value<0.001).
3.5 Discussion
By using quantitative methods, our study suggests a new approach to model emigration considering the push and pull factors and the push–pull link. This benefits the area of research by expanding the scope of methods that were used to model emigration, giving directions for further studies in the field. The obtained results for the three main factors support the findings of earlier researchers, which were often based on the surveys of emigrants. Hence, the performed study validates the importance of these factors using macro data.
Having compared both the economic and non-economic motives for emigration, the study results indicate that it is the economic factors, namely, relative consumer welfare (related to income and living standards) and income inequality and unemployment rate that are key in explaining Lithuanian emigration. The higher importance of economic push and pull factors was also observed by Kumpikaitė-Valiūnienė and Žičkutė (2017) and Kumpikaitė-Valiūnienė et al. (2021).
Deployment of macro data allowed us to provide new insight about the timing of the impact of the push–pull factors. With regard to the magnitude and timing of the main responses, changes in R_AIC have the highest power to change Lithuanian emigration, and the impact occurs the same year. Changes in R_S80S20 and R_U affect fewer emigrants, and it takes longer (1 year) for the effect to materialise. The result could be explained considering the number of people directly affected by these factors. For instance, a third of Lithuanian workers receive wages lower than two thirds of the average (OECD, 2020), while on average 10.7% of working-age individuals were unemployed over the investigated period (Eurostat, 2022). Assuming that the poorer or the unemployed consumers are more affected by the changes in income inequality and the changes in unemployment rate respectively, this could explain the lower scale impact of these factors.
Moving to the directions of the main push–pull factors, the significant emigration-increasing effect observed for the relative consumer welfare (and the average wage) supports the results of researchers (Atoyan et al., 2016; Draženović et al., 2018; Kumpikaitė-Valiūnienė et al., 2021; Kumpikaitė-Valiūnienė & Žičkutė, 2017; Streimikiene et al., 2016; Sipavičienė & Stankūnienė, 2013; Kazlauskienė & Rinkevičius, 2006). Moreover, we find that compared to the conventional wage-related measures of economic welfare, AIC per capita is a better predictor of emigration. This suggests that when considering emigration, people try to maximise consumption, including the goods and services provided by the state. By showing the importance of these services to emigration, our study complements the existing literature, which mostly outlined the importance of income. Moreover, our results support those of other countries, which mostly find that living standards affect migration from the pull side. For instance, the model for migration from the New European Member states (NMS) to the core EU countries suggests that an increase in living standards at the destination country by 1% increases emigration by 2.2%, with no significant effects from the push side (Draženović et al., 2018). In addition, the FE model results for poorer (typically sending) European countries suggest that higher earnings at the origin have a negative impact on emigration, but the effect is not statistically significant at the 0.05 level (Mihi-Ramírez et al., 2017). It is estimated that for the Eastern European countries, higher real GDP per capita (PPP adjusted) in the origin country results in lower emigration but only till it reaches around $40 000 USD (Parker, 2020). As Lithuania reached around $39 000 USD in 2020, this can raise the appeal of Lithuania relative to destination countries by reducing the push-side incentives (OECD, 2021a). The declining role of the low living standards as a push factor is in line with the discussed convergence in consumer welfare between the European countries. Considering the importance of the movements in R_AIC for emigration, this can translate to higher attractiveness of Lithuania, which is supported by the observed positive net migration developments of the recent decade (Statistics Lithuania, 2022).
Considering income inequality, the study results suggest that increased income inequality abroad relative to the Lithuanian level decreases emigration incentives. These results support the findings of scholars (Cimpoeru, 2020; Kumpikaitė-Valiūnienė & Žičkutė, 2017; Kumpikaite & Zickute, 2013; Kumpikaitė-Valiūnienė et al., 2021). Looking at the results of similar states, the RE model outcomes for the NMS suggest that higher income inequality in the origin countries leads to lower net migration (higher emigration) (Cimpoeru, 2020). Moreover, based on the FE model results for poorer (typically sending) European countries, higher income inequality reduces net migration (increasing emigration) but the results are not statistically significant at the 0.05 level (Mihi-Ramírez et al., 2017). Our results for Lithuania are in line with those of other similar states, while the use of relative income inequality resulted in a significant relationship with emigration. Considering the timing of the income inequality effect (first lag), it is supported by the RE model for immigration to the UK over 1976–2000. However, this study found that the rising income inequality in Britain versus other countries at the time was its main attracting factor, particularly for the skilled, as it implied a possibility of a higher return on one’s skill levels (Hatton, 2005). This could be understandable, considering that at the time, emigrants from poorer countries likely associated income inequality in Britain with a richer system that provided more opportunities. However, as the results of our study for Lithuania suggest, higher income inequality can no longer be considered attractive for migrants, indicating a potential shift in their attitude over the years.
It is also found that higher unemployment rate abroad relative to the Lithuanian level decreases emigration. This result supports the findings of other researchers (Atoyan et al., 2016; Cimpoeru, 2020; Draženović et al., 2018; Hazans, 2016; Klüsener et al., 2015; Kumpikaitė-Valiūnienė & Žičkutė, 2017; Kumpikaitė-Valiūnienė et al., 2021; Sipavičienė & Stankūnienė, 2013; Kumpikaite & Zickute, 2013; Streimikiene et al., 2016; Damulienė, 2013). Our results do not contradict the experience of other similar countries. For example, by using the RE model for 28 EU countries for 1999–2017, Trpkova-Nestorovska (2019) found that higher unemployment in the country of origin increases emigration, while Mihi-Ramírez et al. (2017) suggested that higher unemployment rate at the origin is a significant push factor for the poorer European countries. It is also supported by the gravity model results for these countries where unemployment is found to be a significant factor from both the push and pull sides (Atoyan et al., 2016; Draženović et al., 2018).
Moving to the remaining factors, they were found to be rather unimportant compared to the main factors. Nonetheless, the obtained impact directions from the pre-screening stage are discussed. Higher R_SB.L1 is found to have a negative impact on emigration when individual country effects are considered, which is opposite to the results of Hazans (2016), Kumpikaitė-Valiūnienė et al. (2021) and Sipavičienė and Stankūnienė (2013). It also contests the findings for the CESEE countries, where more generous social benefits in receiving countries were found to be the most important pull factor for the unskilled workers but had virtually no effect for the skilled workers (Atoyan et al., 2016). Atoyan et al. (2016) indicate that people with tertiary education made around 33% of the emigrants in 2010. Moreover, the share of labour emigrants with tertiary education is estimated to have been 21% during 2004–2008 and 30% over 2009–2013 (Hazans, 2016). Considering that most emigrants have been less skilled, the obtained effect of relative social protection on emigration is quite unexpected.
Turning to the R_TW variable, it was found that lower relative tax burden has no significant effect on emigration, contesting the findings of Kumpikaitė-Valiūnienė and Žičkutė (2017), Kumpikaite and Zickute (2013) and Kumpikaitė-Valiūnienė et al. (2021). Part of the R_TW effect could be already included in one’s personal consideration in the form of net wage. This is supported by the fact that R_TW is negatively correlated with R_AIC and R_AW. The number of emigrants for whom this factor is more important is likely too little for the effect to be felt on the aggregate level. For instance, the plant, machine operators and assemblers comprise the fourth most popular occupation of Lithuanians abroad, not the first one (OECD, 2018). The same could be for the self-employed individuals. Moreover, the latest labour taxation reform has lowered the Lithuanian tax wedge (European Commission, 2020). These reasons could explain the insignificance of R_TW.
Considering the non-economic factors, the proxy for good job conditions R_Week was found to have no significant impact on emigration, which stands against the findings of Bryer et al. (2020) and Kazlauskienė and Rinkevičius (2006). This could be because of Lithuania’s relatively attractive position of quite little work on weekends in the EU country context, resulting in no strong push factor. This is also supported by the fact that only 0.5% of Lithuanians claim to work very long hours, which is much less compared to the OECD average of 11% (OECD, 2021b). In addition, although working on weekends may be a disadvantage for some, it may be an attractive opportunity to find employment and earn more for those working in particular jobs (e. g., hospitality sector), resulting in no significant effect overall.
It was also found that higher R_Highr corresponds to lower emigration, which is opposite to the anticipated result obtained by other researchers (Streimikiene et al., 2016; Kumpikaitė-Valiūnienė & Žičkutė, 2017; Rakauskienė & Ranceva, 2013; Kazlauskienė & Rinkevičius, 2006). It could be that the proxy variable does not fully reflect the characteristics of better professional development as getting a higher job position does not guarantee a better professional self-realisation. Besides, the fact that workers in a particular country move upwards faster might have its own downsides. For example, it could also mean more intense competition and less security at work as someone might be raised to take up your position. This seems likely considering that, based on the skilled Polish migrants’ evaluation, jobs in the UK have better professional advancement opportunities but contain longer work hours and higher stress levels (Cieslick, 2011).
Finally, considering the relative perception of corruption control, its fourth lag was found to have a positive effect on emigration and was deemed too distant given the length of the time series for further analysis. Nonetheless, the direction of the effect supports the results of Kumpikaitė-Valiūnienė et al. (2021) and Kumpikaitė-Valiūnienė and Žičkutė (2017). One explanation for the timing of the effect (after four years) could be related to the let-down expectations of prospective emigrants regarding the upcoming government election results. If after a four-year term of previously elected perceivably corrupt politicians in power the same politicians were re-elected, this might encourage the unsure emigrants-to-be on their decision to emigrate.
4. Limitations
The study contains some limitations. Having available data, the study used the key predictors identified in Section 1 with higher focus on the case of Lithuania. However, some potentially relevant factors (e. g., personal life conditions, family reasons) could not be included as they require microlevel data. In addition, some studies investigating emigration from several origin countries also considered such push and pull factors as the quality of institutions, the share of tertiary educated, the share of youth, network effects, language and culture barriers. Although not identified as relevant factors in Section 1, these factors may complement further research, especially deploying gravitational models.
Conclusion
The magnitude of emigration of Lithuanian population over the past three decades points to a clear need for investigation of the significant factors shaping migrants’ decisions. Based on the literature review, differences in wage, unemployment and income inequality can be considered the main push–pull factors, while political corruption, unsatisfactory work conditions and self-realisation opportunities can be regarded as important non-economic factors.
The results of our study, obtained by applying quantitative methods to the macro data of 25 European countries, complement these findings. From the analysed economic and non-economic factors, we find that the key determinants of emigration in the case of Lithuania are of economic origin. They are the relative consumer welfare, income inequality and unemployment rate, which validates their importance. Compared to the conventional wage-related measures of economic welfare, actual individual consumption (AIC) is found to be a better predictor of emigration, suggesting that emigrants tend to maximise consumption, including the goods and services provided by the state.
We also estimate the effect of the main factors in the sense of elasticities and provide the early insights on the push–pull factor impact on emigration over time. By magnitude and timing of the main responses, changes in Relative welfare of consumers (R_AIC) have the highest power to change Lithuanian emigration with the impact being felt the same year. Changes in Relative income inequality (R_S80S20) and Relative unemployment (R_U) affect fewer emigrants, and it takes longer (1 year) for the effect to materialise. Consequentially, policy actions to reduce emigration should be directed towards reducing unemployment rate, lowering income inequality and increasing living standards in Lithuania.
By using quantitative methods, our study offers a new approach for modelling emigration with respect to the push and pull factors, considering the push–pull link. The authors believe that these findings contribute to filling the gap in the empirical knowledge on the decisions of migrants to leave their countries of origin. In addition to its direct policy relevance, the study encourages further research on the quantification of the impact of the push–pull factors as well their evaluation over time.
References
Ackers, L., Gill, B., & Guth, J. (2007). Moving People and Knowledge: Scientific Mobility in an Enlarging European Union. Liverpool: European Law and Policy Research Group, Liverpool Law School.
Atoyan, R., Christiansen, L., Dizioli, A., Ebeke, C., Ilahi, N., Ilyina, A., Mehrez, G., Qu, H., Raei, F., Rhee, A.,& Zakharova, D. (2016). Emigration and Its Economic Impact on Eastern Europe. Washington, DC: IMF.
Bryer, T. A., Rauleckas, R., Murealeedharan, V., Butkevičienė, E., Vaičiūnienė, J., Vaidelytė, E., & Miežanskienė, R. (2020). Non-economic Emigration Factors that Might be Pushing Citizens Out of Lithuania. Public Policy and Administration, 19(1), 36, 41–42, 46, 48–49.
Cieslick, A. (2011). Where Do You Prefer to Work? How the Work Environment Influences Return Migration Decisions from the United Kingdom to Poland. Journal of Ethnic and Migration Studies, 37(9), 1371–1373. doi:https://doi.org/10.1080/1369183X.2011.623613
Cimpoeru, S. (2020). A Comparative Analysis for Old vs. New European Member States. Economic Computation and Economic Cybernetics Studies and Research, 54(4/2020), 13, 17–19. doi:10.24818/18423264/54.4.20.01
Damulienė, A. (2013). Migracijos problema Lietuvoje ir jos įtaka šalies ekonomikai. Business Systems And Economics, 3(1), 112, 114–116.
Dormann, C. F., Elith, J., Bacher, S., Buchmann, C., Carl, G., Carré, G., García Marquéz, J. R., Gruber, B., Lafourcade, B., Leitão, P. J., Münkemüller, T., Mcclean, C., Patrick E., Osborne, P. E., Reineking, B., Schröder, B., Skidmore, A. K., Zurell, D., & Lautenbach, S. (2013). Collinearity: A review of methods to deal with it and a simulation study evaluating their performance. Ecography, 36(1), 32. doi:https://onlinelibrary.wiley.com/doi/10.1111/j.1600-0587.2012.07348.x
Draženović, I., Kunovac, M., & Pripužić, D. (2018). Dynamics and determinants of emigration: The case of Croatia and the experience of new EU member states. Public Sector Economics, 42(4), 432–434, 443. doi:https://doi.org/10.3326/PSE.42.4.3
European Commission. (2020). Country Report Lithuania 2020. Brussels: European Commission.
Eurostat. (2017). Statistics Explained. Retrieved from Glossary: Actual individual consumption (AIC): https://ec.europa.eu/eurostat/statistics-explained/index.php?title=Glossary:Actual_individual_consumption_(AIC)#:~:text=Actual%20individual%20consumption%2C%20abbreviated%20as,services%20actually%20consumed%20by%20households.
Eurostat. (2022). Unemployment by sex and age – annual data. Retrieved from https://appsso.eurostat.ec.europa.eu/nui/show.do?dataset=une_rt_a&lang=en
Hatton, T. J. (2005). Explaining trends in UK immigration. Journal of Population Economics, 18(1), 732–736. doi:https://doi.org/10.1007/s00148-005-0015-1
Hazans, M. (2016). Migration Experience of the Baltic Countries in the Context of Economic Crisis. In M. Kahanec & K. F. Zimmermann (Eds.), Labor Migration, EU Enlargement, and the Great Recession (pp. 297–344). doi:10.1007/978-3-662-45320-9_13
Kavalnis, R. (2020). Determinants of Income Inequality in the Baltic States. Retrieved from Nacionalinė Lietuvos akademinė elektroninė biblioteka: https://www.lvb.lt/primo-explore/fulldisplay?docid=ELABAETD64128854&context=L&vid=ELABA&lang=lt_LT&search_scope=eLABa&adaptor=Local%20Search%20Engine&tab=default_tab&query=any,contains,kavalnis&offset=0
Kazlauskienė, A., & Rinkevičius, L. (2006). Lithuanian “Brain Drain” Causes: Push and Pull Factors. Engineering Economics, 1(46), 29, 31–33, 35.
Klüsener, S., Stankūnienė, V., Grigoriev, P., & Jasilionis, D. (2015). The Mass Emigration Context of Lithuania: Patterns and Policy Options. International Migration, 53(5), 181, 183, 185–187, 189. doi:10.1111/imig.12196
Kumpikaite, V., & Zickute, I. (2013). Regression Analysis of Economic Factors Influencing Emigration Rate in Lithuania. Procedia - Social and Behavioral Sciences (92), 458–461. doi:10.1016/j.sbspro.2013.08.701
Kumpikaitė-Valiūnienė, V., & Žičkutė, I. (2017). Emigration after socialist regime in Lithuania: why the West is still the best? Baltic Journal of Management, 12( 1), 88, 92, 93, 95–97, 104. doi:10.1108/BJM-02-2016-0053
Kumpikaitė-Valiūnienė, V., Liubinienė, V., Žičkutė, I., Duobienė, J., Mockaitis, A. I., & Mihi-Ramirez, A. (2021). Migration Culture: A Comparative Perspective. Cham, Switzerland: Springer. doi:https://doi.org/10.1007/978-3-030-73014-7
Lee, E. S. (1966). A Theory of Migration. Demography, 3(1), 1–6.
Mihi-Ramírez, A., Kumpikaitė-Valiūnienė, V., & Cuenca-García, E. (2017). An Inclusive Analysis of Determinants of International Migration. The Case of European Rich and Poor Countries. Technological and Economic Development of Economy, 23(4), 618–619. doi:https://doi.org/10.3846/20294913.2017.1306726
OECD. (2018). OECD Reviews of Labour Market and Social Policies: Lithuania. Paris: OECD Publishing. doi:https://doi.org/10.1787/9789264189935-en
OECD. (2020). OECD Economic Surveys: Lithuania 2020. Paris: OECD Publishing. doi:https://doi.org/10.1787/62663b1d-en
OECD. (2021). Tax wedge. Retrieved from OECD Data: https://data.oecd.org/tax/tax-wedge.htm#indicator-chart
OECD. (2021a). OECD Data. Retrieved from Gross domestic product (GDP): https://data.oecd.org/gdp/gross-domestic-product-gdp.htm
OECD. (2021b). OECD Better Life Index. Retrieved from Lithuania: https://www.oecdbetterlifeindex.org/countries/lithuania/
Parker, E. (2020). Migration Patterns in Eastern Europe and the World: A Gravity Approach. The South East European Journal of Economics and Business, 15(1), 76. doi:https://doi.org/10.2478/jeb-2020-0006
Rakauskienė, O. G., & Ranceva, O. (2013). Threat of Emigration for the Socio-Economic Development of Lithuania. Business, Management and Education, 11(1), 85, 90, 93. doi:http://dx.doi.org/10.3846/bme.2013.05
Rohwer, A. (2009). Measuring Corruption: A Comparison between the Transparency International’s Corruption Perceptions Index and the World Bank’s Worldwide Governance Indicators. CESifo DICE Report, 07(3), 2. Retrieved from http://hdl.handle.net/10419/166975
Sipavičienė, A., & Stankūnienė, V. (2013). The social and economic impact of emigration on Lithuania. In OECD, Coping with Emigration in Baltic and East European Countries (pp. 47–53, 55–56, 58–59). Paris: OECD Publishing. doi:http://dx.doi.org/10.1787/9789264204928-6-en
Statistics Lithuania. (2008). International Migration of the Lithuanian Population. Vilnius: Statistics Lithuania. Retrieved from https://osp.stat.gov.lt/statistikos-leidiniu-katalogas
Statistics Lithuania. (2010). International Migration of the Lithuanian Population. Vilnius: Statistics Lithuania. Retrieved from https://osp.stat.gov.lt/statistikos-leidiniu-katalogas
Statistics Lithuania. (2013). International Migration of the Lithuanian Population. Vilnius: Statistics Lithuania. Retrieved from https://osp.stat.gov.lt/statistikos-leidiniu-katalogas
Statistics Lithuania. (2014). International Migration of the Lithuanian Population. Vilnius: Statistics Lithuania. Retrieved from https://osp.stat.gov.lt/statistikos-leidiniu-katalogas
Statistics Lithuania. (2015). International Migration of the Lithuanian Population. Vilnius: Statistics Lithuania. Retrieved from https://osp.stat.gov.lt/statistikos-leidiniu-katalogas
Statistics Lithuania. (2021). Emigrants, Total (1990–2020). Retrieved from https://osp.stat.gov.lt/statistiniu-rodikliu-analize?hash=7ae84706-e252-40de-85d8-35baecbbb038#/
Statistics Lithuania. (2022). Net migration. Retrieved from https://osp.stat.gov.lt/statistiniu-rodikliu-analize#/
Streimikiene, D., Bilan, Y., Jasinskas, E., & Griksaite, R. (2016). Migration Trends in Lithuania and Other New EU Member States. Transformations in Business & Economics, 15(1 (37)), 27–31.
Transparency International. (2021). Corruption Perceptions Index. Retrieved from https://www.transparency.org/en/cpi/2020/index/nzl
Trpkova-Nestorovska, M. (2019). Factors of emigration: Analysis of countries from the European Union. Knowledge – International Journal, 32(1), 36–37.
Appendix A
Summary of Methods Used by Researchers to Identify Push and Pull Factors
|
Authors |
Methods |
Push factors |
Pull factors |
|
(Atoyan et al., 2016) |
panel gravity model |
• unemployment rate |
• unemployment rate • differences in income per capita • social benefits |
|
(Cimpoeru, 2020) |
random-effects model |
• long term unemployment rate • income inequality |
|
|
(Draženović et al., 2018) |
panel gravity model |
unemployment rate |
• unemployment rate • living standards |
|
(Hazans, 2016) |
situation analysis |
• low social protection • deficient demand for labour |
|
|
(Streimikiene et al., 2016) |
survey data analysis |
• low wages • unemployment • low living conditions |
• better prospects of self-realisation • better carrier opportunities abroad |
|
(Klüsener et al., 2015)* |
multilevel Poison regression |
• being unemployed
|
|
|
(Bryer et al., 2020) |
binary logistic analysis based on a survey |
• perceived low quality of working life |
|
|
(Kumpikaitė-Valiūnienė et al., 2021) |
correlation analysis based on a survey |
• wage in Lithuania • salary differences and income inequality • level of economic development • tax system • social security system • possibilities of employment • political corruption |
|
|
(Kumpikaitė-Valiūnienė & Žičkutė, 2017) |
correlation analysis based on a survey |
• low wages • income inequality • burden of the tax system • unemployment level • political corruption |
• higher wages • better employment opportunities • higher self-development prospects • better self-realisation opportunities |
|
(Kumpikaite & Zickute, 2013) |
linear regression analysis |
• income inequality • unemployment rate • Tax Freedom Day |
|
|
(Sipavičienė & Stankūnienė, 2013) |
situation analysis |
|
• higher income • generous social security • better employment opportunities |
|
(Damulienė, 2013) |
correlation analysis |
• high unemployment |
|
|
(Kazlauskienė & Rinkevičius, 2006) |
association analysis with grouping of factors based on a survey |
• low income for the job • inadequate material conditions • limited options for professional realisation • bad work conditions with insufficient equipment |
• higher wage • the means necessary to do the job • better possibility to improve one’s professional skills |
|
(Rakauskienė & Ranceva, 2013) |
situation analysis |
• limited possibilities for self-realisation, interesting work and self-expression |
|
Note. * – factors increasing the likelihood of emigration.