Ekonomika ISSN 1392-1258 eISSN 2424-6166
2024, vol. 103(1), pp. 91–107 DOI: https://doi.org/10.15388/Ekon.2024.103.1.6
Money Talks: A Holistic and Longitudinal View of the Budget Basket in the Face of Climate Change and Sustainable Finance Matters
Enkeleda Lulaj
Faculty of Business, University Haxhi Zeka, Kosovo
Email: enkeleda.lulaj@unhz.eu
ORCID https://orcid.org/0000-0002-5325-3015
Abstract. This study presents a holistic and longitudinal view of the household budget basket concerning climate change and sustainable finance matters. It aims to understand their impact on the budget basket by examining the relationship between money, climate change and sustainable finance in a global economy for transition countries. Comprehensive CPI data were collected in Kosovo from 2002 to 2022, and data analysis was performed using statistical methods such as t-tests and proximity matrixes in SPSS. The results show significant differences between the average and desired values within the budget basket, indicating changes in consumer behavior, particularly in food expenditures, budget allocations, and climate change impacts. Interesting patterns emerge, such as correlations between bread, cereals, and meat, and the absence of fish in some purchases. Spending on clothing and other goods also deviates from desired values. These findings highlight the complex relationship between money, climate change, sustainable finance, and consumer spending patterns, and underscore the need to address the gap between expected and desired spending values for the global economy in transition economies. Future research should focus on analyzing household spending and its interaction with other factors to improve personal financial management and promote sustainable financial behavior in a larger number of global economies.
Keywords: Money Talks; Sustainable Finance; Climate Change; Budget Basket; Sustainable and Environmental Finance; Finance Matters; Global Finance Economy
_______
Received: 02/08/2023. Revised: 09/09/2023. Accepted: 20/12/2023
Copyright © 2024 Enkeleda Lulaj. Published by Vilnius University Press
This is an Open Access article distributed under the terms of the Creative Commons Attribution License, which permits unrestricted use, distribution, and reproduction in any medium, provided the original author and source are credited.
1. Introduction
This paper explores a crucial issue in the context of finance by examining the holistic and longitudinal view of the budget basket and its link to sustainable finance and climate change. According to (Morgan et al., 2020), consumers require income and development, highlighting the importance of a collective benefits approach to address the lack of coordinated action and weak relationships between central and local levels of government. Further, (Griva et al., 2018) emphasize the power of the budget basket as a tool to understand consumer habits and preferences in the context of climate change and sustainable finance. As for (Proedrou, 2023), the reordering of global economic problems in the era of climate change, sustainable finance, and the budget basket are highlighted. Furthermore, (Campagnolo, 2022) highlights the macroeconomic consequences of climate change on consumer households, while (Wilts et al., 2021) explore the implications of food security in the future. Bhardwaj et al. (2023) examine the risk associated with varying levels of investment at different risk levels. In light of climate change and the need for sustainable financial practices, Lulaj (2023) emphasizes that companies seeking sustainable profitability must innovate in their delivery of information applications such as discounts, product usage guidelines, expiration dates, product composition details, and various payment methods, in addition to offering transportation services to consumers. To effectively implement these changes, companies are advised to utilize cost-volume-profit (CVP) analysis (Lulaj, 2018) and prepare financial statements based on reliable data (Lulaj, 2021). Such strategic approaches are critical to promoting sustainable decision-making in the context of climate change. Furthermore, to promote sustainable finances, (Neill and Lahne, 2022) argue that consumers adopt a spending basket that encourages realistic purchasing decisions, considering various products and their impact on sustainable finances. This aligns with the emphasis placed on residents’ real wages and incomes (consumers) for better evaluation by (Gelman and Santilli, 2018).
Therefore, this study aims to provide a holistic and longitudinal view of the budget basket in the face of climate change and sustainable finance for transitioning countries in the global economy, using data from Kosovo. By examining the complex interactions between money, climate change, and sustainable finance, it aims to deepen the understanding of their dynamics, taking into account historical trends, current challenges, and future projections for the global economy. This knowledge will make it possible to identify patterns, forecast future financial needs, and propose forward-looking solutions that effectively address the impact of climate change on the global economy’s basket of goods and services.
2. Review of Literature and Hypothesis Development
This research takes the reader on an interesting journey into the complex realm of intertwined subjects: money talks, climate change, and sustainable finance, through a holistic and longitudinal view of the budget basket. So, the analysis of global challenges that affect the budget basket is highlighted by (Seo, 2020). On the other hand, (Fuest and Meier, 2023) and (Li et al., 2022) emphasize the importance of sustainable financing in low-carbon investments and country-oriented policies for consumers’ budget basket, climate technologies, access to financial institutions. Additionally, (Iacobuţă et al., 2022) stresses the need for harmonization in climate actions, while (Carè and Weber, 2023) highlight the importance of climate financing. Moreover, (Cheng et al., 2022) underscore the significance of climate change related to the budget basket, and sustainable finance, as they are all intricately interconnected. According to (Tariq and Hassan, 2023), green financing has a significant impact on financial sustainability, purchasing power, and climate change in the context of sustainable social interactions, as well as the economic and demographic risks posed by climate change (Zhu et al., 2023). However, according to (Cevik and Jalles, 2023), climate change has a strong correlation with income inequalities on a global scale within the budget basket, as well as the environmental budget to prevent climate change (He et al., 2023).
Ayanlade et al. (2023) underscore the necessity for a comprehensive understanding of the complex risks associated with climate change, sustainable finance, and consumer budget baskets. This includes exploring how these risks interact with socioeconomic factors, as well as the impact of social factors and population characteristics, as highlighted by Cattaneo and Foreman (2023). Regarding the intricate relationship between financial systems, climate change, and sustainable development, according to Chaikumbung (2023) and Biswas and Rahman (2023) explore the connection between corruption, financial trust, and public willingness to address climate change. Their findings underscore the importance of financial integrity in fostering climate action. According to Lagoarde-Segot (2019) emphasizes the crucial role of sustainable finance in the 21st century, which Geng et al. (2018) elaborate on by examining the fluctuating sustainability index of financing.
Reforming sustainable finance and circular economy are important in reducing the impacts of climate change and social inequalities (Sepetis, 2022), and finance plays a crucial role in socio-technical transitions, and it is time to understand their role, which is why further research is needed to explore the potential of transition structures (Steffen and Schmidt, 2021). But in order for families to have a well-being, the state must reduce tax expenses for businesses as it indirectly affects the budget basket, (Lulaj and Dragusha,2022), and also ensure a fair distribution of public expenditure so that all citizens benefit equally (Lulaj et al, 2022; Lulaj, 2021 & 2022). According to (Fuest and Meier, 2023), sustainable financing incurs costs for climate policies and consumers’ budget baskets to develop a system that prevents food losses (Krestyanpol, 2023) and sheds light on budgeting behaviors and beliefs related to the budgeting process at the family level for consumption and savings behavior (Zhang et al., 2022). Hence, the budget basket offers different choices of goods and services (Shi and Cheng, 2023). Moreover, (Caputo and Lusk, 2022) emphasize that consumers select their preferred items or make combinations of two or three items in their budget baskets during purchases, using hedonic methods to easily assess the affordability of paying prices and the quantity of product purchase in a budget basket. However, (Musarat et al., 2021) emphasize the proposal of a structure to include inflation in budget evaluation and prevent cost overruns in the budget basket in the face of climate change and sustainable finance.
H1: There is a complex relationship between money, climate change, sustainable finance, and how consumers utilize their funds to purchase products and services in the budget basket in the global economy
H2: There exists a discrepancy between the expected value and desired value of expenditures on variables within the budget basket in the face of climate change and sustainable finance matters in the global economy.
3. Methodology
3.1. Data Collection
During the data collection process for the analysis of the Consumer Price Index in Kosovo for the period 2002–2022, official secondary data published by the Statistical Office of Kosovo were used.
3.2. The econometric analyses of the research
Two analytical methods have been employed to perform data analysis: One Sample Test and Proximity Matrix. A statistical t-test can be used to assess the discrepancy between the expected value and desired value of expenses on variables within the budget basket in the context of climate change and sustainable finance in the global economy (Al-Kassab, 2022), (Gerald, 2018) to validate the hypothesis. The data processing in this study utilized the statistical software SPSS across 5 sections.
4. Results
In the results section, the main findings regarding money talks through a holistic and longitudinal view in the budget basket concerning climate change and the importance of sustainable finance will be presented for countries in transition in the world economy with data from Kosovo. It was evident that sustainable financing can improve access to prices, and purchases, and ensure a more sustainable and adaptable budget basket to current challenges. This section will include subsections as follows:
4.1. Money talks in the budget basket through the variable of food expenses
4.2. Money talks in the budget basket through the variable of beverage expenses
4.3. Money talks in the budget basket through the variable of clothing and shoes expenses
4.4. Money talks in the budget basket through the variable of household expenses
4.5. Money talks in the budget basket through the variable of various goods and services expenses
4.1. Money talks in the budget basket through the variable of food expenses
In the first section, the impact of climate change and sustainable finance on consumer food consumption was analyzed, including its subvariables: bread and cereals (BRCE), meat (ME), fish (FI), milk, cheese, and eggs (MICHEG), oils and fats (OIFA), fruits (FRU), vegetables (VEG), sugar, jam, honey, chocolate, and sweets (SJHCHSW), as well as various food products (FOOPR).
Table 1 presents the results of the distance method between the dependent variable of food expenses and the independent variables (BRCE, ME, FI, MICHEG, OIFA, FRU, VEG, SJHCHSW, and FOOPR). The Var (BRCE) has the closest distance with (ME). The Var(ME) has the closest distance with (MICHEG). The Var(FI) has the closest distance with (FOOPR). The Var(MICHEG) has the closest distance with (VEG). The Var(OIFA) has the closest distance with (FOOPR). The Var(FRU) has the closest distance with (SJHCHSW). The Var(VEG) has the closest distance with (SJHCHSW). According to Kruskal’s stress statistics, the following findings for the matrixes are emphasized: between a variable with years (Stress=0.01554, RSQ=0.99989) the significance is 99%, between one variable and other variables (Stress=0.13348, RSQ=0.89846) the significance is 90%, between one year and the variables (Stress=0.02683, RSQ=0.99781) the fit is 99%, and between one year and other years (Stress=0.07001, RSQ=0.98949) the significance is 99%.
Table 1. Proximity Matrix for the food variable in the budget basket
|
Proximity Matrix |
|||||||||
|
Indep. Var. |
Euclidean Distance |
||||||||
|
BRCE |
.000 |
||||||||
|
ME |
10.399 |
.000 |
|||||||
|
FI |
196.074 |
187.688 |
.000 |
||||||
|
MICHEG |
59.814 |
51.936 |
137.629 |
.000 |
|||||
|
OIFA |
166.688 |
158.413 |
29.612 |
108.331 |
.000 |
||||
|
FRU |
153.287 |
144.961 |
42.821 |
95.060 |
13.678 |
.000 |
|||
|
VEG |
100.642 |
92.552 |
95.825 |
42.113 |
66.382 |
53.171 |
.000 |
||
|
SJHCHSW |
155.334 |
147.043 |
40.863 |
96.972 |
11.449 |
3.111 |
55.031 |
.000 |
|
|
FOOPR |
170.249 |
161.967 |
26.051 |
111.960 |
3.857 |
17.161 |
70.005 |
15.063 |
.000 |
|
Dependent variable: Food |
|||||||||
|
Matrix- Z Scores (Stress & RSQ) |
|||||||||
|
For the matrix between a variable with years |
Stress = .01554 RSQ = .99989 |
||||||||
|
For the matrix between one variable and other variables |
Stress = .13348 RSQ = .89846 |
||||||||
|
For the matrix between one year and the variables |
Stress = .02683 RSQ = .99781 |
||||||||
|
For the matrix between one year and other years |
Stress = .07001 RSQ = .98949 |
||||||||
Note: Var=variable
Table 2 presents the results of the One Sample T-test for food expenses variable during the years 2002–2022. The (BRCE), the mean budget basket value is (18.26), while the desired value was (TV=90), indicating a significant difference between both values (-71.74%, p=0.000). The Var(ME), the mean budget basket value is (17.52), while the desired value was (VT=90), highlighting a significant difference between both values (-72.48%, p=0.000). The Var(FI), the mean budget basket value is (0.85), while the expected value was (VT=90), demonstrating a significant difference between both values (-89.15%, p=0.000). The Var(MICHEG), the mean budget basket value is (13.05), while the expected value was (VT=90), indicating a significant difference between both values (-76.95%, p=0.000). The Var(OIFA), the mean budget basket value is (3.46), while the expected value was (VT=90), showing a significant difference between both values (-86.54%, p=0.000). The Var(FRU), the mean budget basket value is (4.65), while the expected value was (VT=90), indicating a significant difference between both values (-85.35%, p=0.000). The Var(VEG), the mean budget basket value is (9.35), while the expected value was (VT=90), demonstrating a significant difference between both values (-80.65%, p=0.000). The Var(SJHCHSW), the mean budget basket value is (4.47), while the expected value was (VT=90), indicating a significant difference between both values (-85.53%, p=0.000). The Var(FOOPR), the mean budget basket value is (3.15), while the expected value was (VT=90), showing a significant difference between both values (-86.85%, p=0.000).
Table 2. One Sample Test for the food variable in the budget basket
|
One-Sample Statistics |
One-Sample Test |
|||||||||
|
Test Value = 90 |
||||||||||
|
N |
Mean |
Std. Deviation |
Std. Error Mean |
t |
df |
Sig. (2-tailed) |
Mean Difference |
95% Confidence Interval of the Difference |
||
|
Lower |
Upper |
|||||||||
|
BRCE |
22 |
18.263 |
40.807 |
8.7001 |
-8.245 |
21 |
.000 |
-71.73636 |
-89.829 |
-53.6435 |
|
ME |
22 |
17.518 |
39.141 |
8.3450 |
-8.686 |
21 |
.000 |
-72.48182 |
-89.836 |
-55.1274 |
|
FI |
22 |
.8545 |
1.9128 |
.40781 |
-218.59 |
21 |
.000 |
-89.14545 |
-89.993 |
-88.2974 |
|
MICHEG |
22 |
13.045 |
29.222 |
6.2302 |
-12.352 |
21 |
.000 |
-76.95455 |
-89.911 |
-63.9980 |
|
OIFA |
22 |
3.4636 |
7.7867 |
1.6601 |
-52.126 |
21 |
.000 |
-86.53636 |
-89.988 |
-83.0839 |
|
FRU |
22 |
4.6545 |
10.406 |
2.2186 |
-38.467 |
21 |
.000 |
-85.34545 |
-89.959 |
-80.7315 |
|
VEG |
22 |
9.3455 |
20.927 |
4.4616 |
-18.077 |
21 |
.000 |
-80.65455 |
-89.933 |
-71.3760 |
|
SJHCHSW |
22 |
4.4727 |
10.019 |
2.1362 |
-40.036 |
21 |
.000 |
-85.52727 |
-89.969 |
-81.0847 |
|
FOOPR |
22 |
3.1455 |
7.0770 |
1.5088 |
-57.564 |
21 |
.000 |
-86.85455 |
-89.992 |
-83.7168 |
Note: Var=variable
4.2. Money talks in the budget basket through the variable of beverage expenses.
In the second section, the impact of climate change and sustainable finance on consumer beverage consumption has been analyzed, including its sub-variables such as coffee, tea, and cocoa (COTECO), as well as mineral water, soft drinks, fruit and vegetable juices (MWSDFGJ).
Table 3. Proximity Matrix for the beverage expenditure variable
|
Proximity Matrix |
|||
|
Indep. Var. |
Euclidean Distance |
||
|
COTECO |
.000 |
||
|
MWSDFGJ |
9.388 |
.000 |
|
|
Dependent variable: Soft drinks |
|||
|
Matrix- Z Scores (Stress & RSQ) |
|||
|
For the matrix between a variable with years |
Stress = .00000 RSQ = 1.00000 |
||
|
For the matrix between one variable and other variables |
Stress = .15412 RSQ = .99112 |
||
|
For the matrix between one year and the variables |
Stress = .11283 RSQ = .98182 |
||
|
For the matrix between one year and other years |
Stress = .00000 RSQ = 1.00000 |
||
Note: Var=variable
Table 3 presents the results of the distance method between the dependent variable of beverage expenses and the independent variables (COTECO and MWSDFGJ). The Var(COTECO) has a close distance with (MWSDFGJ). According to Kruskal Stress statistics, the following findings for the matrixes are emphasized: between a variable with years (Stress=0.00000, RSQ=1.00000) the significance is 100%, between one variable and other variables (Stress=0.15412, RSQ=0.99112) the significance is 99%, between one year and the variables (Stress=0.11283, RSQ=0.98182) the significance is 98%, and between one year and other years (Stress=0.00000, RSQ=1.00000), the significance is 100%.
Table 4. One-Sample Test for the beverage expenditure variable
|
One-Sample Statistics |
One-Sample Test |
|||||||||
|
Test Value = 90 |
||||||||||
|
N |
Mean |
Std. Deviation |
Std. Error Mean |
t |
df |
Sig. (2-tailed) |
Mean Difference |
95% Confidence Interval of the Difference |
||
|
Lower |
Upper |
|||||||||
|
COTECO |
21 |
1.5238 |
.49589 |
.10821 |
-817.622 |
20 |
.000 |
-88.47619 |
-88.7019 |
-88.2505 |
|
MWSDFGJ |
21 |
3.2190 |
.93948 |
.20501 |
-423.299 |
20 |
.000 |
-86.78095 |
-87.2086 |
-86.3533 |
Note: Var=variable
Table 4 presents the results of the One Sample T-test for the beverage expenses variable during the years 2002–2022. The Var(COTECO), the average budget basket expenditure is (1.52), while the desired value was (TV=90). This is a significant difference between both values (-88.48%, p=0.000). The Var(MWSDFGJ), the average budget basket expenditure is (3.22), while the desired value was (VT=90). It is highlighted that there is a significant difference between both values (-87.21%, p=0.000).
4.3. Money talks in the budget basket through the variable of clothing and shoes expenses
In the third section, the impact of climate change and sustainable finance on consumer purchases of clothing and shoes has been analyzed, including its sub-variables: Clothing (CLO) and Shoes (SHOE).
Table 5. Proximity Matrix for clothing and shoe expenses variable
|
Proximity Matrix |
||
|
Independent variables |
Euclidean Distance |
|
|
CLO |
.000 |
|
|
SHOE |
12.245 |
.000 |
|
Dependent variable: Clothing and shoes |
||
|
Matrix- Z Scores (Stress & RSQ) |
||
|
For the matrix between a variable with years |
Stress = .06973 RSQ = .98536 |
|
|
For the matrix between one variable and other variables |
Stress = .03652 RSQ = .99237 |
|
|
For the matrix between one year and the variables |
Stress = .00503 RSQ = .99988 |
|
|
For the matrix between one year and other years |
Stress = .02770 RSQ = .99775 |
|
Note: Var=variable
Table 5 presents the results of the distance method for the variable of clothing and shoe expenses, considering the independent variables (CLO and SHOE). The Var (CLO) exhibits a close proximity with (SHOE). The Kruskal Stress statistics reveal the following for the matrixes findings: between a variable and years (Stress=0.06973, RSQ=0.98536) the significance is 99%, between one variable and other variables (Stress=0.03652, RSQ=0.99237) the significance is 99%, between one year and the variables (Stress=0.00503, RSQ=0.99988) the significance is 100%, and between one year and other years (Stress=0.02770, RSQ=0.99775) the significance is 100%.
Table 6. One-Sample Test for clothing and shoe expenses variable
|
One-Sample Statistics |
One-Sample Test |
|||||||||
|
Test Value = 90 |
||||||||||
|
N |
Mean |
Std. Deviation |
Std. Error Mean |
t |
df |
Sig. (2-tailed) |
Mean Difference |
95% Confidence Interval of the Difference |
||
|
Lower |
Upper |
|||||||||
|
CLO |
21 |
4.6476 |
1.46309 |
.31927 |
-267.335 |
20 |
.000 |
-85.35238 |
-86.0184 |
-84.6864 |
|
SHOE |
21 |
2.0857 |
1.01355 |
.22117 |
-397.487 |
20 |
.000 |
-87.91429 |
-88.3756 |
-87.4529 |
Note: Var=variable
Table 6 presents the results of the One Sample T-test for the variable of beverage expenses during the years 2002–2022. The Var(CLO), the average budget basket is (4.65), while the desired value was (TV=90). Therefore, there is a significant difference between both values (-85.35%, p=0.000). The Var(SHOE), the average budget basket is (2.09), while the desired value was (VT=90). It is emphasized that there is a significant difference between both values (-87.91%, p=0.000). The observed values are significantly lower than the expected values, indicating pronounced differences in clothing and footwear purchases.
4.4. Money talks in the budget basket through the variable of household expenses
In the fourth section, the impact of climate change and sustainable financing on household expenditures of consumers has been analyzed, including its sub-variables such as current housing payment (CUHOPA), maintenance and arrangement of residence (MAARRRE), water supply and various services related to the residence (WSVSRR), and electricity, gas, and other fuels (ELGAOFU).
Table 7 presents the results of the distance method between the dependent variable of household expenses with the independent variables (CUHOPA, MAARRRE, WSVSRR, and ELGAOFU). The Var(CUHOPA) has the closest distance with the variable (MAARRRE). The Var(MAARRRE) has the closest distance with (WSVSRR). The variable (WSVSRR) has the closest distance with (ELGAOFU). According to Kruskal Stress statistics, the following findings for the matrixes are emphasized: between a variable with years (Stress=0.15810, RSQ=0.88874) the significance is 89%, between one variable and other variables (Stress=0.05884, RSQ=0.98809) the significance is 99%, between one year and the variable (Stress=0.00691, RSQ=0.99989) the significance is 100%, and between one year and other years (Stress=.06196, RSQ=.98750) the significance is 99%.
Table 7. Proximity Matrix for the variable of household expenses
|
Proximity Matrix |
|||||
|
Indep. Var. |
Euclidean Distance |
||||
|
CUHOPA |
.000 |
||||
|
MAARRRE |
1.817 |
.000 |
|||
|
WSVSRR |
2.283 |
1.493 |
.000 |
||
|
ELGAOFU |
27.075 |
25.902 |
25.340 |
.000 |
|
|
Dependent variable: Housing, water, electricity, gas and other fuels |
|||||
|
Matrix- Z Scores (Stress & RSQ) |
|||||
|
For the matrix between a variable with years |
Stress = .15810 RSQ = .88874 |
||||
|
For the matrix between one variable and other variables |
Stress = .05884 RSQ = .98809 |
||||
|
For the matrix between one year and the variables |
Stress = .00691 RSQ = .99989 |
||||
|
For the matrix between one year and other years |
Stress = .06196 RSQ = .98750 |
||||
Note: Var=variable
Table 8 presents the results of the One Sample T-test for the variable of household expenses during the years 2002–2022. The Var(CUHOPA), the average budget basket is (0.52), while the desired value was (TV=90). There is a significant difference between both values (-89.48%, p=0.000). The Var(MAARRRE), the average budget basket is (0.82), while the desired value was (VT=90). It is emphasized that there is a significant difference between both values (-89.18%, p=0.000). The Var(WSVSRR), the average budget basket is (0.94), while the desired value was (VT=90), and it is highlighted that there is a significant difference between both values (-89.06%, p=0.000). The Var(ELGAOFU), the average budget basket is (6.25), while the desired value was (VT=90), and it is emphasized that there is a significant difference between both values (-83.75%, p=0.000).
Table 8. One-Sample Test for the variable of household expenses
|
One-Sample Statistics |
One-Sample Test |
|||||||||
|
Test Value = 90 |
||||||||||
|
N |
Mean |
Std. Deviation |
Std. Error Mean |
t |
df |
Sig. (2-tailed) |
Mean Difference |
95% Confidence Interval of the Difference |
||
|
Lower |
Upper |
|||||||||
|
CUHOPA |
21 |
.5190 |
.17210 |
.03756 |
-2382.620 |
20 |
.000 |
-89.48095 |
-89.559 |
-89.4026 |
|
MAARRRE |
21 |
.8238 |
.20225 |
.04413 |
-2020.559 |
20 |
.000 |
-89.17619 |
-89.268 |
-89.0841 |
|
WSVSRR |
21 |
.9429 |
.27124 |
.05919 |
-1504.610 |
20 |
.000 |
-89.05714 |
-89.180 |
-88.9337 |
|
ELGAOFU |
21 |
6.2476 |
1.47466 |
.32180 |
-260.265 |
20 |
.000 |
-83.75238 |
-84.423 |
-83.0811 |
Note: Var=variable
4.5. Money talks in the budget basket through the variable of various goods and services expenses
In the fifth section, the influence of climate change and sustainable financing on consumer expenditures for goods and other services was analyzed, including its sub-variables: personal care (PECA), personal items (PEIT), social protection (SOPR), insurance (INS), financial services (FISER), and other services (OTHSER).
Table 9. Proximity Matrix for Consumer Expenditures on Goods and Other Services
|
Proximity Matrix |
|||||||
|
Indep. Var. |
Euclidean Distance |
||||||
|
PECA |
.000 |
||||||
|
PEIT |
6.869 |
.000 |
|||||
|
SOPR |
8.226 |
2.587 |
.000 |
||||
|
INS |
6.829 |
1.068 |
2.261 |
.000 |
|||
|
FISER |
6.914 |
1.439 |
2.661 |
1.404 |
.000 |
||
|
OTHSER |
7.547 |
2.007 |
.894 |
1.507 |
2.040 |
.000 |
|
|
Dependent variable: Furnishings, home appliances and home maintenance |
|||||||
|
Matrix- Z Scores (Stress & RSQ) |
|||||||
|
For the matrix between a variable with years |
Stress = .13195 RSQ = .93765 |
||||||
|
For the matrix between one variable and other variables |
Stress = .06413 RSQ = .97878 |
||||||
|
For the matrix between one year and the variables |
Stress = .07006 RSQ = .98819 |
||||||
|
For the matrix between one year and other years |
Stress = .12774 RSQ = .95979 |
||||||
Note: Var=variable
Table 9 presents the results of the distance method between the dependent variable of consumer expenditures on goods and various services and the independent variables (PECA, PEIT, SOPR, INS, FISER, and OTHSER). The Var(PECA) has a close distance to the Var(INS). The Var(PEIT) has a close distance to the Var(INS). The Var(SOPR) has a close distance to the Var(OTHSER). The Var(INS) has a close distance to the variable (FISER). The Var(FISER) has a close distance to the Var(OTHSER). According to Kruskal Stress statistics, the following findings for the matrixes are highlighted: between a variable with years (Stress=0.13195, RSQ=0.93765) the significance is 94%, between one variable and other variables (Stress=0.06413, RSQ=0.97878) the significance is 98%, between one year and the variables (Stress=0.07006, RSQ=0.98819) the significance is 99%, and between one year and other years (Stress=0.12774, RSQ=0.95979), the significance is 96%.
Table 10 presents the results of the One Sample T-test for the variable of consumer expenditure on the purchase of goods and various services, along with the independent variables during the years 2002–2022. The Var (HOSE), the average budget basket is (0.78), while the desired value was (TV=90), indicating a significant difference between both values (-88.17%, p=0.000). The Var(PEIT), the average budget basket is (0.18), while the desired value was (VT=90), highlighting a significant difference between both values (-89.68%, p=0.000). The Var(SOPR), the average budget basket is (0.62), while the desired value was (VT=90), emphasizing a significant difference between both values (-89.91%, p=0.000). The Var(INS), the average budget basket is (0.38), while the desired value was (VT=90), indicating a significant difference between both values (-89.54%, p=0.000). The Var (FISER), the average budget basket is (1.09), while the desired value was (VT=90), pointing out a significant difference between both values (-89.49%, p=0.000). The Var(OTHSER), the average budget basket is (0.24), while the desired value was (VT=90), indicating a significant difference between both values (-89.76%, p=0.000).
Table 10. One Sample Test for Consumer Expenditures on Goods and Other Services
|
One-Sample Statistics |
One-Sample Test |
|||||||||
|
Test Value = 90 |
||||||||||
|
N |
Mean |
Std. Deviation |
Std. Error Mean |
t |
df |
Sig. (2-tailed) |
Mean Difference |
95% Confidence Interval of the Difference |
||
|
Lower |
Upper |
|||||||||
|
PECA |
.7762 |
-909.523 |
20 |
.000 |
-88.1666 |
-88.3689 |
-87.9645 |
|||
|
PEIT |
.1810 |
-1020.599 |
20 |
.000 |
-89.4952 |
-89.6782 |
-89.3123 |
|||
|
SOPR |
.6238 |
-13697.717 |
20 |
.000 |
-89.9095 |
-89.9232 |
-89.8958 |
|||
|
INS |
.3810 |
-1191.655 |
20 |
.000 |
-89.5428 |
-89.6996 |
-89.3861 |
|||
|
FISER |
1.0905 |
-1022.356 |
20 |
.000 |
-89.4904 |
-89.6731 |
-89.3079 |
|||
|
OTHSER |
.2429 |
-3296.207 |
20 |
.000 |
-89.7571 |
-89.8139 |
-89.7003 |
|||
Note: Var=variable
Figure 1 shows the proximity matrix using the (Euclidean distance model and the scatterplot of linear fit), and OTS (One Simple Test). It includes sections (S1-5) and examines relationships between variables and years, variables and other variables, years and variables, and years and other years. In Section 1 (S1), focusing on the food expenses variable and its subvariables (BRCE, ME, FI, MICHEG, OIFA, FRU, VEG, SJHCHSW, and FOOPR), notable insights emerge. Consumers buying bread and cereals tend to purchase meat but not fish. Meat buyers also opt for cheese and eggs while avoiding fish. Fish buyers tend to diversify their purchases, excluding cheese and eggs. Shoppers of cheese and eggs show a preference for vegetables, excluding oils and fats. Oils and fats shoppers tend to diversify their choices, excluding spices. Fruit and spice shoppers diversify by choosing sugar, jam, honey, chocolate, and confectionery. In Section 2 (S2), examining the beverage expenditure variable and its subvariables (COTECO and MWSDFGJ), the key finding is that consumers purchasing coffee, tea, and cocoa also tend to buy mineral water, soft drinks, and fruit or vegetable juices. In Section 3 (S3), exploring the clothing and shoes expenditure variables and their subvariables (CLO and SHOE), the results indicate that consumers who buy clothing also tend to purchase shoes. In Section 4 (S4), analyzing the household expenditure variables and their subvariables (CUHOPA, MAARRRE, WSVSRR, and ELGAOFU), trends highlight that consumers paying for housing expenses also allocate funds for maintenance and furnishings. Those financing housing maintenance also allocate resources for water supply and related services. Similarly, those covering household expenses also allocate resources for electricity, gas, and fuel. In Section 5 (S5), examining the variable related to consumer expenses on miscellaneous goods and services and its subvariables (PECA, PEIT, SOPR, INS, FISER, and OTHSER), the findings reveal that buyer preferences, such as those purchasing personal items, allocate funds to insurance, and spending on social protection is associated with other services. This understanding provides valuable insights that underpin sustainable global economic development and stability.
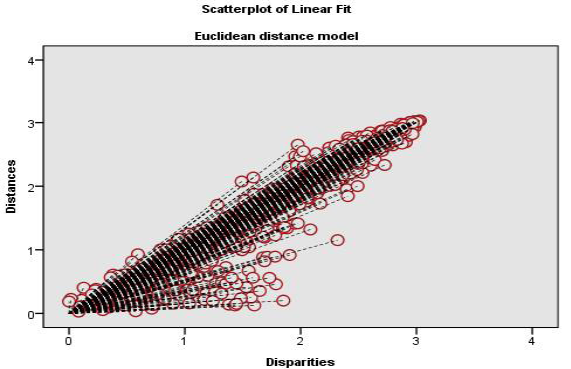
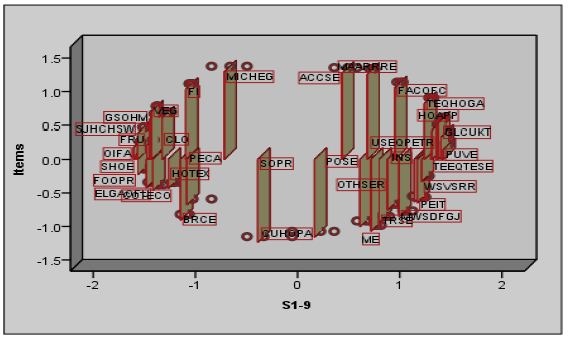
Figure 1. Proximity Matrix – OTS (S1-5)
Table 11. Hypothesis Verification for all sections (S1-8)
|
No. |
Econometric Methods and Analyses |
Hypothesis |
Factors |
Interpretation |
|
1 |
Proximity Matrix |
H1: There is a complex relationship between money, climate change, sustainable finance, and how consumers utilize their funds to purchase products and services in the budget basket in the global economy |
Money talks in the budget basket through the variable of food expenses. |
Approved |
|
Money talks in the budget basket through the variable of beverage expenses. |
Approved |
|||
|
Money talks in the budget basket through the variable of clothing and footwear expenses. |
Approved |
|||
|
Money talks in the budget basket through the variable of household expenses. |
Approved |
|||
|
Money talks in the budget basket through the variable of various goods and services expenses. |
Approved |
|||
|
2 |
One Sample Test (OST) |
H2: There exists a discrepancy between the expected value and desired value of expenditures on variables within the budget basket in the face of climate change and sustainable finance matters in the global economy. |
Money talks in the budget basket through the variable of food expenses. |
Approved |
|
Money talks in the budget basket through the variable of beverage expenses. |
Approved |
|||
|
Money talks in the budget basket through the variable of clothing and footwear expenses. |
Approved |
|||
|
Money talks in the budget basket through the variable of household expenses. |
Approved |
|||
|
Money talks in the budget basket through the variable of various goods and services expenses. |
Approved |
Table 11 provides an overview of the hypotheses’ elaboration and their subsequent verification. The Proximity Matrix highlights the inclusion of various expenditure variables within the budget basket, encompassing categories such as food, beverages, clothing and footwear, household expenses, home maintenance, transportation, communication devices, restaurant and hotel visits, as well as other goods and services. Hypothesis 1 (H1) reveals a complex relationship between money, climate change, sustainable finance, and the allocation of consumer funds within these expenditure variables. Furthermore, the One Sample Test demonstrates the pivotal role of money across all aspects of the budget basket, influencing expenditures on food, beverages, clothing and footwear, household expenses, and other goods and services. The validated hypothesis (H2) suggests the existence of a discrepancy between the expected and desired values of expenses within each of these variables, particularly when addressing climate change and sustainable finance matters.
5. Discussion
The various research studies conducted in the fields of climate change, sustainable finance, and budgeting were presented for the global economy, so these studies shed light on the key elements of individuals’ expenses that are influenced by climate change, including food, beverages, housing, consumer goods of households (Lulaj et al., 2021). Regarding financial stability in a global economy (Cicen, 2023), it was emphasized that weak institutions can exacerbate financial shocks. Similarly, (Luick et al., 2023) highlighted the importance of prioritizing healthy food choices in budgeting and developing strategies to align consumer goals with climate and sustainable finance matters. Their research suggests that these efforts can lead to sustainable consumption patterns and enhance consumer awareness regarding the carbon footprint of the products they consume, as emphasized by (Kanay et al., 2021). Moreover, (Ulvidienė et al., 2023) highlighted a significant increase in interstate economic competition in recent decades. Collaborative efforts among consumers, as emphasized by (Grashuis and Hakelius, 2023), can foster increased competition and help prevent food price inflation (promoting fairness, equal access to food, and income equality (Hough and Contarini, 2023), further (Tsouli, 2022), it is emphasized that financial inclusion is significantly related to poverty. As per Lulaj (2020), the crucial connection between education, effective budget practices, and environmental influences reveals insights into budget management among groups from Kosovo, Western Balkan countries, and European countries, offering practical recommendations for sustainable finance. While previous studies have provided initial insights into the relationship between personal spending and climate challenges, this research delves deeper, providing a holistic and longitudinal view of this critical issue. The findings provide clear evidence that food expenses, as observed through the market basket, reveal significant disparities between desired and actual expenses. So, uncovers interesting patterns within consumer food preferences, such as the correlation between bread and cereals and meat, and the exclusion of fish in certain purchases. Consumers who buy coffee, tea and cocoa also tend to buy mineral water, soft drinks and fruit or vegetable juices. Looking at clothing and shoes expenses within the budget basket, this research reveals a strong correlation between these expenditures and the impacts of climate change and sustainable finance. These findings underscore the importance of thoughtful planning and budgeting for leisure activities within the context of climate change and sustainable financial practices, contributing to a more resilient and sustainable global economy.
6. Conclusions and Future Studies
This study provides a deep and clear overview of the link between sustainable finance, climate change, and budget basket, offering important information for countries, businesses, and households. Food consumption was lower than expected, indicating pronounced changes in consumer behavior regarding food. Interesting patterns were identified in budget allocations, such as the correlation between bread and cereals with meat, as well as the absence of fish in some purchases. Findings showed intriguing connections in the budget allocations of consumers purchasing beverages, including drinks like coffee, tea, and cocoa, with mineral water, nonalcoholic beverages, and fruit or vegetable juices. Expenses on clothing and shoes significantly differed from desired values, highlighting the need to consider factors and temporal aspects in consumer purchases. Overall, expenses on goods and services demonstrated the complexity and interdependency of consumer behavior. The recommendations focus on creating a more sustainable and resilient world economy by fostering responsible consumer behavior, sustainable budget planning, and promoting sustainable financial choices in various sectors. Future studies should focus on: analyzing the interaction between household expenditures and other factors for personal financial management and promoting sustainable financial behavior; identifying ways and strategies to promote sustainable financial behavior in the context of climate change and sustainable finance.
References
Al-Kassab, M. (2022). The Use of One Sample t-Test in the Real Data. Journal of advances in mathematics, 21, 134–138. Https://doi.org/10.24297/jam.v21i.9279.
Ayanlade, A., Smucker, TH., S., Nyasimi, M., Sterly, H., Weldemariam, L., F., & Simpson, N. (2023). Complex climate change risk and emerging directions for vulnerability research in Africa. Climate Risk Management, 40, 100497. https://doi.org/10.1016/j.crm.2023.100497.
Bhardwaj, A., Hanawal, M., K., & Parthasarathy, P. (2023). Almost exact risk budgeting with return forecasts for portfolio allocation. Operations Research Letters, 51(2), 171-175. https://doi.org/10.1016/j.orl.2023.02.002.
Biswas, R., R., & Rahman, A. (2023). Adaptation to climate change: A study on regional climate change adaptation policy and practice framework. Journal of Environmental Management. Volume 336, 117666, https://doi.org/10.1016/j.jenvman.2023.117666.
Campagnolo, L., & De Cian, E. (2022). Distributional consequences of climate change impacts on residential energy demand across Italian households. Energy Economics, 110, 106020. https://doi.org/10.1016/j.eneco.2022.106020.
Carè, R. & Weber, O. (2023). How much finance is in climate finance? A bibliometric review, critiques, and future research directions. Research in International Business and Finance. Volume 64, 101886, https://doi.org/10.1016/j.ribaf.2023.101886
Cattaneo, C., & Foreman, T. (2023). Climate change, international migration, and interstate conflicts. Ecological Economics, 211, 107890, https://doi.org/10.1016/j.ecolecon.2023.107890
Cevik, S., Jalles, J., T. (2023). For whom the bell tolls: Climate change and income inequality. Energy Policy, 174, 113475, https://doi.org/10.1016/j.enpol.2023.113475.
Chaikumbung, M. (2023). The effects of institutions and cultures on people’s willingness to pay for climate change policies: A meta-regression analysis. Energy Policy, Volume 177, J113513, https://doi.org/10.1016/j.enpol.2023.113513.
Cicen Y. B. (2023). The Nexus Between Institutional Quality and Inflation in Emerging Markets: A Panel Causality Test with a Fourier Function. Ekonomika, 102(1), 140-152. https://doi.org/10.15388/Ekon.2023.102.1.8 Caputo, V., and Lusk, J., L. (2022). The Basket-Based Choice Experiment: A Method for Food Demand Policy Analysis. Food Policy, Volume 109, 102252, https://doi.org/10.1016/j.foodpol.2022.102252.
Cheng, S., L., Lucey, B., Kumar, S., Zhang, D., and Zhang, Zh. (2022). Climate finance: What we know and what we should know? Journal of Climate Finance, Volume 1, 100005, https://doi.org/10.1016/j.jclimf.2023.100005.
Fuest, C., & Meier, V. (2023). Sustainable finance and climate change: Wasteful but a political commitment device? Journal of Environmental Economics and Management, Volume 118, 102795. https://doi.org/10.1016/j.jeem.2023.102795.
Gelman, G., & Santilli, D. (2018). Wages and standards of living in the 19th century from a comparative perspective. Consumption basket, Bare Bone Basket and welfare ratio in Buenos Aires, 1825–1849. Investigaciones de Historia Económica, 14 (2), 94-106. https://doi.org/10.1016/j.ihe.2016.09.001.
Geng, B., Zhang, X., Liang, Y., Bao, H. & Skitmore, M. (2018). Sustainable land financing in a new urbanization context: theoretical connotations, empirical tests and policy recommendations. Resources, Conservation and Recycling, volume 128, 336-344. https://doi.org/10.1016/j.resconrec.2016.11.013.
Gerald, B. (2018). A Brief Review of Independent, Dependent and One Sample t-test. International Journal of Applied Mathematics and Theoretical Physics, 4(2), 50-54. https://doi.org/10.11648/j.ijamtp.20180402.13
Grashuis, J., & Hakelius, K. (2023). Pricing strategies of corporations and consumer co-operatives in the food retail sector: Evidence from England, Sweden, and the Netherlands. Journal of Co-operative Organization and Management, 11(1), 100204. https://doi.org/10.1016/j.jcom.2023.100204.
Griva, A., Bardaki, C., Pramatari, K., & Papakiriakopoulos, D. (2018). Retail business analytics: Customer visit segmentation using market basket data. Expert Systems with Applications, 100 (15), 1-16. https://doi.org/10.1016/j.eswa.2018.01.029.
He, P., Zhang, Sh., Wang, L., & Ning, J. (2023). Will environmental taxes help to mitigate climate change? A comparative study based on OECD countries. Economic Analysis and Policy. https://doi.org/10.1016/j.eap.2023.04.032.
Hough, G., & Contarini, A. (2023). Can low-income consumers choose food from sustainable production methods? Current Opinion in Food Science, 51, 101035. https://doi.org/10.1016/j.cofs.2023.101035
Iacobuţă, G., I., Brandi, C., Dzebo, A., Donaji, S., & Duron, E. (2022). Aligning climate and sustainable development finance through an SDG lens. The role of development assistance in implementing the Paris Agreement. Global Environmental Change, 74, 102509. https://doi.org/10.1016/j.gloenvcha.2022.102509.
Kanay, A., Hilton, D., Charalambides, L., Corrégé, J.B., Inaudi, E., Waroquier, L., & Cézéra, S. (2021). Making the carbon basket count: Goal setting promotes sustainable consumption in a simulated online supermarket. Journal of Economic Psychology,83, 102348. https://doi.org/10.1016/j.joep.2020.102348.
Krestyanpol, L. (2023). Simulation modeling of consumer behavior within the concept of smart consumption. Procedia Computer Science, 217, 774-783. https://doi.org/10.1016/j.procs.2022.12.274.
Li, Q., Sharif, A., Razzaq, A., & Yu, Y. (2022). Do climate technology, financialization, and sustainable finance impede environmental challenges? Evidence from G10 economies. Technological Forecasting and Social Change, 185, 122095. https://doi.org/10.1016/j.techfore.2022.122095.
Luick, M., Pechey, R., Harmer, G., Bandy, L., Jebb, S., A., & Piernas, C. (2023). The impact of price promotions on confectionery and snacks on the energy content of shopping baskets: A randomised controlled trial in an experimental online supermarket. Appetite, Volume 186,106539, https://doi.org/10.1016/j.appet.2023.106539.Lulaj, E. (2021). Accounting, Reforms and Budget Responsibilities in the Financial Statements. Oblik i finansi, Institute of Accounting and Finance, issue 1, 61-69, DOI: 10.33146/2307-9878-2021-1(91)-61-69
Lulaj, E. (2023). A sustainable business profit through customers and its impacts on three key business domains: technology, innovation, and service (TIS). Business, Management and Economics Engineering, 21(1), 19–47. https://doi.org/10.3846/bmee.2023.18618
Lulaj, E. (2018). Role of Analysis CVP (Cost-Volume-Profit) as Important Indicator for Planning and Making Decisions in the Business Environment. European Journal of Economics and Business Studies, 4(2), pp. 99-114, https://doi.org/10.26417/ejes.v4i2.p104-120.
Lulaj, E. (2021). Quality and reflecting of financial position: an enterprises model through logistic regression and natural logarithm. Journal of Economic Development, Environment and People, 10(1), 26-50. http://dx.doi.org/10.26458/jedep.v10i1.690
Lulaj, E. (2022). An unstoppable and navigating journey towards development reform in complex financial-economic systems: an interval analysis of government expenses (past, present, future). Business, Management and Economics Engineering, 20(2), 329–357. https://doi.org/10.3846/bmee.2022.17389
Lulaj, E., & Dragusha, B. (2022). Incomes, Gaps and Well-Being: an Exploration of Direct Tax Income Statements Before and During Covid-19 Through the Comparability Interval. International Journal of Professional Business Review, 7(6), e0623. https://doi.org/10.26668/businessreview/2022.v7i6.623
Lagoarde-Segot, T. (2019). Sustainable finance. A critical realist perspective. Research in International Business and Finance, Volume 47, Pages 1-9, https://doi.org/10.1016/j.ribaf.2018.04.010
Lulaj, E. (2020). Budget Education and Management as a Necessity for Well-Being and Financial Stability: Cluster & MDS Analysis. International Journal of Financial Research, 11(6), pp. 348-364, https://doi.org/10.5430/ijfr.v11n6p348.
Lulaj, E., Dragusha, B., Lulaj, D., Rustaj, V., & Gashi, A. (2021). Households savings and financial behavior in relation to the ability to handle financial emergencies: case study of Kosovo. Acta Scientiarum Polonorum. Oeconomia, 20(1), 35–48. https://doi.org/10.22630/ASPE.2021.20.1.4
Lulaj, E., Zarin, I., & Rahman, Sh. (2022). A Novel Approach to Improving E-Government Performance from Budget Challenges in Complex Financial Systems, Complexity, vol. 2022, Article ID 2507490, 16, https://doi.org/10.1155/2022/2507490
Morgan, E., A., Buckwell, A., Guidi, C., Garcia, B., Rimmer, L., Cadman, T., & Mackey, B. (2022). Capturing multiple forest ecosystem services for just benefit sharing: The Basket of Benefits Approach. Ecosystem Services, 55, 101421. https://doi.org/10.1016/j.ecoser.2022.101421.
Musarat, M., A., Alaloul, W.S., & Liew, M.S. (2021). Impact of inflation rate on construction projects budget: A review. Ain Shams Engineering Journal, 12 (1), 407-414. , https://doi.org/10.1016/j.asej.2020.04.009.
Neill, C., L. & Lahne, J. (2022). Matching reality: A basket and expenditure based choice experiment with sensory preferences. Journal of Choice Modelling, 44, 100369. https://doi.org/10.1016/j.jocm.2022.100369.
Proedrou, F. (2023). The global climate impasse and the way forward: A global political economy and ecological economics’ perspective. Reference Module in Social Sciences.
Seo, S., N. (2020). 8 - Extensions of the economic theory to a basket of globally shared goods. The Economics of Globally Shared and Public Goods, 281-305. https://doi.org/10.1016/B978-0-12-819658-8.00008-1.
Sepetis, A. (2022). Chapter 13 - Sustainable finance and circular economy. Circular Economy and Sustainability, Volume 1: Management and Policy, 207-226. https://doi.org/10.1016/B978-0-12-819817-9.00002-8.
Steffen, B., & Schmidt. T.S. (2021). Strengthen finance in sustainability transitions research. Environmental Innovation and Societal Transitions, 41, 77-80. https://doi.org/10.1016/j.eist.2021.10.018. Shi, Zh., and Cheng, J. (2023). How do government subsidies and consumers’ low-carbon preference promote new energy vehicle diffusion? A tripartite evolutionary game based on energy vehicle manufacturers, the government and consumers. Heliyon, Volume 9, Issue 3, e14327, https://doi.org/10.1016/j.heliyon.2023.e14327.
Tariq, A., & Hassan, A. (2023). Role of green finance, environmental regulations, and economic development in the transition towards a sustainable environment. Journal of Cleaner Production, 413, 137425. https://doi.org/10.1016/j.jclepro.2023.137425. Tsouli D. (2022). Financial Inclusion, Poverty, and Income Inequality: Evidence from European Countries. Ekonomika, 101(1), 37-61. https://doi.org/10.15388/Ekon.2022.101.1.3
Ulvidienė E., Meškauskaitė I., Stavytskyy A., & Giedraitis V. R. (2023). An Investigation of the Influence of Economic Growth on Taxes in Lithuania. Ekonomika, 102(1), 41-59. https://doi.org/10.15388/Ekon.2023.102.1.3
Wilts, R., Latka, C., & Britz, W. (2021). Who is most vulnerable to climate change induced yield changes? A dynamic long run household analysis in lower income countries. Climate Risk Management. https://doi.org/10.1016/j.crm.2021.100330.
Zhang, Y., C., Sussman, A., Wang-Ly, N. & Lyu., Gj., K. (2022). How consumers budget. Journal of Economic Behavior & Organization, 204, 69-88. https://doi.org/10.1016/j.enpol.2007.03.007.
Zhu, P., Zhang, Z., & Lin, B. (2023). Understanding spatial evolution of global climate change risk: Insights from convergence analysis. Journal of Cleaner Production. https://doi.org/10.1016/j.jclepro.2023.137423.