Ekonomika ISSN 1392-1258 eISSN 2424-6166
2022, vol. 101(1), pp. 20–36 DOI: https://doi.org/10.15388/Ekon.2022.101.1.2
Business Performance Evaluation Practice in Manufacturing Sector in Latvia
Inta Kotane
Faculty of Economics and Management, Rezekne Academy of Technologies, Latvia
Email: Inta.kotane@rta.lv
Iveta Mietule
Faculty of Economics and Management, Rezekne Academy of Technologies, Latvia
Email: iveta.mietule@rta.lv
Abstract. The manufacturing sector plays an important role in promoting Latvia’s economic growth; this sector is one of the largest sectors of the Latvian economy. Performance can be described as one of the most important categories of economic analysis; however, there is no consensus among researchers on the business performance indicators, their measurement and evaluation methods. The research is based on the analysis of special literature and scientific publications, the evaluation of the financial ratios used in the financial analysis of companies by Latvian institutions, the results of an expert survey, and data from the Official Statistics Portal of Latvia. Literature analysis, expert surveys, correlations, multiple linear regression and forecasting methods were used in the research. The aim of the research is to identify and summarize the performance evaluation practices of manufacturing companies in Latvia. As a result of the research, the business performance evaluation practice in the manufacturing sector was analyzed, the significance of the financial ratios used in the financial analysis in the business performance evaluation in the manufacturing sector and the existence of statistically significant correlations between the financial analysis indicators of manufacturing companies and the key business indicators of manufacturing companies were identified and evaluated.
Keywords: performance, manufacturing, financial indicators, evaluation.
________
Received: 03/12/2021. Revised: 10/01/2022. Accepted: 06/02/2022
Copyright © 2022 Inta Kotane, Iveta Mietule. Published by Vilnius University Press
This is an Open Access article distributed under the terms of the Creative Commons Attribution License, which permits unrestricted use, distribution, and reproduction in any medium, provided the original author and source are credited.
1. Introduction
Manufacturing plays an important role in promoting Latvia’s economic growth. In 2020, manufacturing accounted for 12% in the total value added structure, and, compared to 2019, manufacturing production volumes in 2020 decreased by 0.9%. In turn, in 2021, the manufacturing sector was experiencing rapid growth. In the period from January to July, the sector’s production volumes exceeded the level of the corresponding period of the previous year by 8.3% (Ministry of Economics…, 2021). The growth of the manufacturing sector generally follows the economic growth of a particular country. The economic cycle growth of any country is a cyclic fluctuation process due to various dynamic conditions of the country and the world (Jasti & Kodali, 2016). Economic analysts tend to pay more attention to the manufacturing sector. It refers to the general state of the economy quite accurately: the successes or failures of the sector often indicate the processes that will take place in the future with the economy as a whole (Kasjanovs, 2015).
Manufacturers today are faced with complex global challenges (Alomar & Pasek, 2015) as the increasing globalization, uncertain environment, rapid technological development and competitive pressures force manufacturers to adopt different practices and tools to improve manufacturing processes, operations and their supply chains (Khalfallah & Lakhal, 2020). Competitive pressures are driving manufacturing firms to continuously re-evaluate and adjust their competitive strategies, supply chains, and manufacturing technologies in order to improve performance, compete, and survive long term (Alomar & Pasek, 2015).
The increasing number of academic publications shows a growing interest in performance management issues in Central and Eastern European countries, especially among local researchers (Paladi & Fenies, 2016). It should be noted that the given research does not refer to the publications of Latvian scientists on the given topic.
The authors of the article have not identified any research in the public space that would address the issues of performance measurement and management, including the study of the relationship between the financial indicators of manufacturing enterprises and the indicators characterizing business activity and, in particular, the case of Latvian manufacturing enterprises.
This research is based on the analysis of special literature and scientific publications, the assessment of financial ratios used in the financial analysis of Latvian institutions, the results of an expert survey (conducted in October 2021) and data from the Latvian Official Statistics Portal (LOSP) (Official Statistics Portal, 2021) covering the period from 2010 to 2019. Only publicly available information describing Latvian manufacturing companies was used for the research from 2010 to 2019, and specific data were available only on an annual basis and without dividing manufacturing companies into categories (micro, small, medium, or large). The Central Statistical Bureau (CSB), as one of the LOSP statistical institutions, obtains data only from the annual reports of enterprises (financial indicators) submitted to the State Revenue Service as well as by conducting a full and sample survey until 2016 and conducting a full survey starting in 2017 (business indicators) (Central Statistical Bureau, 2021).
The aim of the research is to perform analysis of the business performance evaluation practices in the manufacturing sector in Latvia. The object of the research is the financial indicators used in the business performance evaluation in the manufacturing sector. The novelty of the research is the significance of the financial ratios used in the financial analysis in the business performance evaluation in the manufacturing sector; hence, the existence of statistically significant correlations between the financial analysis indicators of manufacturing companies and the key business indicators of manufacturing companies were identified and evaluated. Literature analysis, expert surveys, correlations, multiple linear regression and forecasting methods were used in the research.
2. Business performance: literature review
2.1. Business performance measurement and evaluation
Performance is a multidimensional and contextual concept that can be disaggregated into constituent dimensions that reflect the company’s competitive priorities (Costa Ferreira Junior & Fleury, 2018). Performance measurement systems are an important part of the decision-making process and performance improvements (Midovska-Petkoska et al., 2020). The basics of performance measurement lay in organizational and management control theories derived from the general systems theory (Smith & Bititci, 2017). Over the past 20 years, the field of performance measurement has evolved from measurement (i.e., what to measure, how to measure, and how to report results) to management (i.e., how to use measurement to manage organizational performance) (Bititci et al., 2015).
Today’s performance measurement system is multidimensional; it includes financial and non-financial measurements, uses leading and lagging indicators, and links performance measurements to the organization’s strategy (Baird, 2017; Seo & Lee, 2019; Endrikat et al., 2020). Sahlin and Angelis (2019) contributed to the understanding of performance measurement and management research in dynamic and digital environments. In the recent decades, there has been a growing interest in developing innovative and strategic performance measurement systems (Midovska-Petkoska et al., 2019; Asiaei et al., 2021; Hristov et al., 2021).
2.2. Company’s financial performance
Business performance usually includes two components – financial performance and non-financial performance (Seo & Lee, 2019). Financial performance is used to describe the company performance that can be measured in terms of monetary value and financial transactions. Non-financial measurements are the company performance that cannot be measured in terms of monetary value, such as brand reputation, customer satisfaction and innovation activities. Financial performance is usually linked to the short-term survival of companies, while non-financial performance refers to long-term sustainable growth.
Firm financial performance is used as a tool measuring the current development and potential growth of an organization. Although there are many indicators estimating financial performance, the choice of appropriate ratios depends on the characteristics of the studied objects and the study purposes (Le Thi Kim et al., 2021). For example, as concluded in (Alshehhi et al., 2018), 78% of publications report a positive relationship between corporate sustainability and financial performance.
Fatihudin et al. (2018) believe that “financial performance is the company’s financial condition over a certain period that includes the collection and use of funds measured by several indicators of capital adequacy ratio, liquidity, leverage, solvency, and profitability. Financial performance is the company’s ability to manage and control its resources.” Financial performance measures are expressed in monetary terms, such as revenue or profit, for instance (Mashovic, 2018). Financial performance is based on estimated profits, sales and cash flow (Ahmad & Jamil, 2020). Le Thi Kim et al. (2021) state that ROE and ROS are two of the most used ratios to measure financial performance. When studying the impact of the financial indicators on the company’s financial performance, Borhan et al. (2014) concluded that the current ratio, quick ratio, debt ratio, and return on sales have a positive relationship, while the debt-to-equity ratio and the operating profit margin have a negative relationship with the company’s financial performance.
The authors believe that, despite the increasing number of publications in the scientific literature on this topic, there is no consensus among researchers on the performance indicators of companies, their measurement and evaluation methods.
In the subsequent presentation of the research, the authors shall evaluate the financial ratios used in the analysis of financial performance of Latvian companies with the aim of summarizing the Latvian practice in the evaluation of the company financial performance.
3. Research methodology
The research is based on the analysis of special literature and scientific publications, the evaluation of the financial ratios used by LOSP, Lursoft Ltd. databases, and the CrediWeb portal for financial analysis of companies and the results of the expert survey.
The research complements and continues the expert survey of the previous researches. In February 2016, an expert survey was conducted without distinguishing a specific economic sector (Kotane, 2016); in July 2016, a survey of experts in the transport and storage sector (Kotane & Kuzmina-Merlino, 2017) was performed, and, in October 2021, a survey of experts in the manufacturing sector was implemented. The choice of experts was determined by their level of education as well as academic and/or professional work experience in companies.
Based on the data of LOSP, it was researched whether there are statistically significant correlations between the financial analysis indicators of companies in the manufacturing sector (dependent variables) and the key business indicators of companies in the manufacturing sector (independent variables); stationarity in time line indicators were detected; linear regression analysis was performed to determine the effect of the independent variables on the dependent variables, and forecasts of the independent and dependent variables values for the next three years were developed.
The Shapiro-Wilk test was used to determine whether the data are in normal distribution in order to select an appropriate correlation method. The Pearson’s r correlation test was used to determine the relationship between the two numerical parameters. If there is 100% correlation between the features, then r is ± 1, but if there is no correlation, then the result is 0. The correlation is statistically significant if its test’s p or statistical significance value is less than 0.05 or 5.00 x 10- 2. A significant relationship is considered to exist if the value of r is greater than |0.40|. Correlation analysis was performed before and after differentiation of the indicators.
To detect whether the values (time line) are time-dependent or not, stationarity for all data was determined by using the Dickey-Fuller test. For time-dependent or trend-dependent variables, time-series data were transformed by using first-order differences.
For both transformed and non-transformed indicators, multiple regression was performed, in which the effect of several features (independent variables) on another feature (dependent variables) was determined. Prior to regression, the data were examined for (1) normal distribution, (2) the presence of homoscedasticity of the error term, and (3) the absence of autocorrelation in the error term. The regression analysis using a variance inflation factor (VIF) or a correlation matrix eliminated multicollinearity between the independent variables. The regression coefficient R2 indicates the percentage (R2 x 100) of cases which the given model explains, or the proportion affected by the performance value. The Enter model was used for the regression analysis. The regression model or the direct effect was considered significant if the value of statistical reliability (p) of the ANOVA test performed in the analysis was less than 0.05. The significance of the independent variable in the regression equation was evaluated by the statistical significance of the coefficient of the regression equation (p <0.05).
Given that the independent variables are expressed as large numbers (in millions and thousands), but the result values are coefficients within 100, then the real analyzed numbers are divided by 100,000 so that the regression coefficients are not expressed as small numbers.
Forecasts of the independent and dependent variables for 2020–2022, using data for the period from 2010 to 2019, were created by using the analysis of time-series variables or forecasting. Within the framework of the analysis, the forecast was made for each time period that already had data and for three additional time periods using the best model. In addition, a confidential interval of 95% was established. The desired R2 level for a forecast to be considered successful is at least 0.85.
4. Research results
4.1. Performance measurement practice in Latvia: institutional approach
In Latvia, the information on company finances can be found in three institutions. The financial ratios used in the financial analysis of companies on OSPL, Lursoft Ltd. and the CrediWeb portal are shown in Table 1. The authors highlighted the same financial ratios used in the financial analysis of companies.
It can be concluded from Table 1 that all three above-mentioned institutions are using the following financial ratios in the financial analysis of companies: current ratio, debt/equity ratio, and return on assets. The other financial ratios, with the exception of the assets turnover ratio, the cash ratio, and the short-term debt ratio in balance, are used by at least two of the above-mentioned institutions.
The issue of developing a certain system of financial indicators which, possibly, would help to effectively manage the company’s financial situation, is very important for all Latvian companies. The development of the system for evaluating financial indicators is important not only for companies, but also for the state, because comparative analysis by economic sectors is performed, and analytical reports on the financial situation in the state are compiled on the basis of these indicators.
Table 1. Financial ratios used in the financial analysis of companies
|
LOSP |
Lursoft Ltd. |
CrediWeb portal |
|
Assets turnover ratio |
Accounts receivable turnover, days |
|
|
Payables turnover, days |
||
|
Inventory turnover, days |
||
|
Current ratio |
||
|
Cash ratio |
Quick ratio |
|
|
Debt-to-equity ratio |
- |
|
|
Debt ratio |
Equity ratio |
|
|
Short-term debt ratio in balance |
- |
- |
|
- |
Gross profitability |
|
|
Return on assets (ROA) |
||
|
Return on equity (ROE) |
||
|
Return on sales (ROS) |
Return on sales (ROS) |
|
Sources: created by the authors and based on the CrediWeb portal, 2021; Lursoft Ltd., 2021, and Official Statistics Portal, 2021
4.2. Performance measurement practice in Latvia: expert opinion
In the course of the research, an expert survey was conducted, in which 5 industry experts were interviewed to assess the significance of financial ratios used in the financial analysis to evaluate the performance of manufacturing companies and rank them according to significance on a scale from 1 (the most important indicator, or priority No. 1, in business performance evaluation) to 14 (the least significant indicator, or priority No. 14). The area experts were selected by their level of education (experts A, C, and E – Mg.oec.; expert B – Dr.oec.) and academic and/or professional work experience (the experience of all experts exceeds 10 years, and the professional work experience of expert D exceeds 20 years).
The answers provided by the experts were evaluated according to the degree of agreement. In the case of direct parameter evaluation, the degree of expert agreement is evaluated by the concordance coefficient W (Kendall, 1955) according to Formula 1:
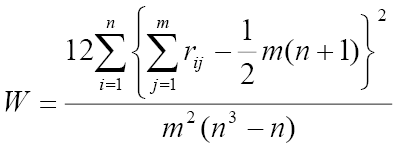 (1)
(1)
where, W – concordance coefficient
n – number of factors to be assessed
m – number of experts
rij – rank of object i according to expert j
The value of the concordance coefficient varies in the interval 0≤W≤1; moreover, W=0 if there is no correlation between the ranks, and W=1 if all experts ranked the objects equally. The concordance value of W≥0.50 is assumed to be sufficient, and it is considered that the expert consensus is high enough (Kendall, 1955).
The calculated concordance coefficient is W=0.55, which indicates that the experts were generally unanimous in their views and unanimously acknowledged the following financial ratios as the most important financial ratios in the business performance evaluation at the manufacturing sector (Table 2): gross profitability; accounts receivable turnover, days; return on sales (ROS); return on equity (ROE); payables turnover, days; inventory turnover, days, and return on assets.
Table 2. Results of expert evaluations
|
Financial ratios |
Experts |
Sum of evaluation Li |
di=Li –Lvid |
di2 |
Rank R |
||||
|
A |
B |
C |
D |
E |
|||||
|
Evaluation |
|||||||||
|
Current ratio |
10 |
13 |
4 |
13 |
8 |
48 |
10.5 |
110.25 |
9 |
|
Cash ratio |
12 |
12 |
13 |
11 |
7 |
55 |
17.5 |
306.25 |
13 |
|
Quick ratio |
11 |
11 |
14 |
12 |
9 |
57 |
19.5 |
380.25 |
14 |
|
Assets turnover, times |
5 |
14 |
10 |
14 |
6 |
49 |
11.5 |
132.25 |
10.5 |
|
Accounts receivable turnover, days |
7 |
3 |
7 |
4 |
4 |
25 |
-12.5 |
156.25 |
4 |
|
Accounts payable turnover, days |
8 |
4 |
8 |
5 |
10 |
35 |
-2.5 |
6.25 |
7 |
|
Inventory turnover, days |
3 |
5 |
11 |
6 |
2 |
27 |
-10.5 |
110.25 |
5 |
|
Debt-to-equity ratio |
13 |
6 |
9 |
7 |
11 |
46 |
8.5 |
72.25 |
8 |
|
Debt ratio/Equity ratio |
14 |
9 |
6 |
9 |
14 |
52 |
14.5 |
210.25 |
12 |
|
Short-term debt ratio in balance |
9 |
8 |
12 |
8 |
12 |
49 |
11.5 |
132.25 |
10.5 |
|
Gross profitability |
2 |
7 |
3 |
3 |
3 |
18 |
-19.5 |
380.25 |
2 |
|
Return on assets (ROA) |
4 |
10 |
5 |
10 |
5 |
34 |
-3.5 |
12.25 |
6 |
|
Return on equity (ROE) |
6 |
1 |
2 |
1 |
13 |
23 |
-14.5 |
210.25 |
3 |
|
Return on sales (ROS) |
1 |
2 |
1 |
2 |
1 |
7 |
-30.5 |
930.25 |
1 |
|
n=14 |
m=5 |
∑Li= 525 |
0 |
S=3149.5 |
- |
||||
Source: the authors’ calculations based on data obtained in October 2021
The authors compared the results of the survey of experts in the manufacturing sector with the results of surveys of the experts conducted in February 2016 (Kotane, 2016) and July 2016 (Kotane & Kuzmina-Merlino, 2017). The analysis shows that experts in February and July 2016 and in October 2021 recognized the same ratios as the most important ones in the business performance evaluation (the first 7 ranks) as only the significance of the financial ratios is different.
Comparing the financial ratios used by the institutions in the financial analysis of companies (Table 1) with the financial ratios ranked by the experts (Table 2), it can be concluded that experts indicated as the most significant the financial ratios used by at least two institutions in the financial analysis of companies.
Further research on the financial indicators of the business performance evaluation practices is related to the research of the significance of financial ratios used in the financial analysis of companies based on the purpose of the business performance evaluation (financial analysis for raising funds, in the interests of business owners, etc.).
4.3. Performance measurement practice in Latvia: official statistics
Based on the statistical data of the LOSP, it was researched whether there are statistically significant correlations between the financial analysis indicators of companies in the manufacturing sector (dependent variables) and the key business indicators of companies in the manufacturing sector (independent variables); it was also investigated whether it is possible to create an algorithm for predicting dependent variables.
The following financial analysis indicators of companies in the manufacturing sector and key business indicators of companies in the manufacturing sector were studied (Table 3).
Given that all indicators are used to describe the performance of companies, the interrelation or correlation of specific indicators was considered. The correlation analysis of the dependent variables shows that the full or 100% correlation is ROS and ROA, but ATR does not have at least close (>0.70) and statistically reliable correlations with other dependent variables. There are both direct (both dependent variables change the same – increase or decrease) and inverse (when one dependent variable decreases, the other dependent variable decreases and vice versa) correlations are observed between the other dependent variables. Linear relationships between other dependent variables can be assessed according to the value of the correlation coefficient as moderately close (0.4–0.7), close (0.71–0.9) or very close (0.91–0.99) with at least one or more other dependent variables.
When evaluating the mutual correlation of the independent variables, we found that there are two pairs of the independent variables with a statistically significant correlation of 100% (PerCosts vs. ValAdd and Turnover vs. ProV). This means that PerCosts, as the total remuneration in cash or in kind paid by an employer to an employee as remuneration for the work, including the employer’s social security costs, affects ValAdd – the value of production without the value of goods and services used in production, and it shows the increase of the product’s market value resulting from economic activity. Also, the changes of ProV, which is the volume of products produced or services provided, are closely related to Turnover, which consists of revenue from the sale of goods and the provision of services. Consequently, only one of these pairs can be included in the regression analysis in order to exclude multicollinearity.
Table 3. Financial analysis and key business indicators of companies in the manufacturing sector
|
Independent values |
Abbr. |
Dependent values |
Abbr. |
|
Number of companies |
NuC |
Debt ratio (at the end of year, times) |
DR |
|
Turnover (1000s of euro) |
Turnover |
Short-term debt ratio (at the end of year, times) |
ShTDR |
|
Production value (1000s of euro) |
ProV |
Debt-to-equity ratio (at the end of year, times) |
DtER |
|
Gross margin on goods for resale (1000s of euro) |
GrMargGS |
Current ratio (at the end of year, times) |
CR |
|
Value added at factor cost (1000s of euro) |
ValAdd |
Cash ratio (at the end of the year, times) |
CaR |
|
Gross operating surplus (1000s of euro) |
GrPoS |
Assets turnover ratio (times) |
ATR |
|
Total purchase of goods and services (1000s of euro) |
TotPGS |
Return on sales (%) |
ROS |
|
Personnel costs (1000s of euro) |
PerCosts |
Return on assets (%) |
ROA |
|
Gross investment in tangible goods (1000s of euro) |
GrInTG |
Return on equity (%) |
ROE |
|
Number of persons employed |
NumPerEmp |
There are direct correlations between the other independent variables, when both independent variables increase, and the linear relations between the other independent variables can be assessed according to the value of the correlation coefficient as moderately close (0.4–0.7), close (0.71–0.9) or very close (0.91–0.99) with at least one or more other independent variables.
Given that all indicators are time line data, the stationarity of the indicators was also determined before the regression analysis. It was found that the timeline of all indicators is trend-based or time-dependent and not stationary. Therefore, in order to exclude time dependence in the regression analysis, the data were further transformed by using first-order differences.
After the transformation, the key business indicators (the independent variables) of the manufacturing industry were re-correlated to ensure that the previous correlations were maintained. The correlation analysis concluded that only five pairs maintained close (one case) or very close correlation. So, the relationship between these pairs is independent of the time period. A statistically significant correlation triangle is formed between ProV, Turnover and TotPGS (r between 0.98 and 0.99), but ValAdd has a statistically significant correlation with GrPoS (r = 0.93) and PerCosts (r = 0.79). Accordingly, the values in these pairs will be primarily excluded from the regression analysis to achieve a regression model without multicollinearity, or the VIF for all values would be less than 10.
In addition, it was determined if the correlation between dependent and independent variables exists, as regression analysis is only relevant if there is a known correlation between the dependent and the independent variables. As a result of the correlation, it was concluded that, in some cases, the dependent variables correlate with the independent variables, which means that only in these cases a regression analysis can be performed with differentiated data. Accordingly, four regression analyzes are possible: DR, DtER, CR, and ATR. In addition, ATR correlates with all three indicators: ProV, Turnover and TotPGS which are interrelated.
The obtained regression models (Table 4) could be used regardless of time, but, accepting that, in the case of differentiated indicators, the value of the previous time period must also be taken into account in the calculation or use of the algorithm. This means that a differentiated (change in the value of a particular time period from the previous period) independent variable must be used in the regression equation and that the calculated value must also be differentiated or added to the value of the dependent indicator of the previous time period.
Table 4. One-factor regression equations for differentiated dependent variables
|
Dependent variable |
R2 |
Regression equation |
|
Diff DR |
0.45 |
= -0.015 – (0.35 * Diff NumPerEmp/ 100,000) |
|
Diff DtER |
0.47 |
= -0.098 – (3.22 * Diff NumPerEmp/ 100,000) |
|
Diff CR |
0.52 |
= -0.039 – (0.024 * Diff GrInTG / 100,000) |
|
Diff ATR |
0.96 |
= -0.027 + (0.013 * Diff Turnover / 100,000) |
Based on the fact that it was possible to create only four regression equations for the dependent variables which are independent of time, and one factor, it was decided to create regression equations without transforming the data. Thus, the dependence of the timeline on the time or trend was left. It was found that the independent variables interact with the dependent variables, and this occurs depending on the time of all the variables considered.
Multifactorial regression was performed in two ways: (1) by excluding variables when using VIF and (2) by excluding variables manually when using the correlation matrix.
Both regression models have GrMargGS, GrInTG, NumPerEmp in common, but there are two additional values in Model 1 and one value in Model 2.
The obtained data show that by using a VIF value, a statistically reliable regression model consists of five variables: NuC, GrMargGS, TotPGS, GrInTG and NumPerEmp, which, in general, are able to explain all the dependent variables by at least 70%, but in six cases even by more than 90%. Thus, with regression equations, it is possible to accurately calculate the value of the dependent variable for a given time period.
Based on the correlation table of the independent variables, four variables were manually selected (GrMargGS, ValAdd, GrInTG, NumPerEmp) to be included in the regression analysis so that to avoid multicollinearity.
The regression analysis with a set of four independent variables revealed that it was not possible to develop a statistically reliable regression model to explain ShTDR and ATR, which could be done with the analysis of five independent variables or the 1st regression model. In addition, it is possible to explain 99.43% of the dependent variable with a statistically significant negative effect of NuC and a positive effect of NumPerEmp by the regression model of ATR with a set of five independent variables.
In the case of DR, two statistically reliable regression models are created. In the model with five independent variables, the explanatory part of the dependent variable is 95.80% (R2 = 0.96), but, with four independent variables, it equals 96.39% (R2 = 0.96). In the model of five independent variables or the 1st regression model, the largest and statistically significant effect on the dependent variable has NuC whose β coefficient is -0.73, but, in the 2nd regression model, the effect of ValAdd is almost twice as large as NumPerEmp (by β: in the case of ValAdd -0.81 vs -0.32) (Table 5). According to both equations, it is possible to calculate the dependent variable with high explainability, but each regression model has a different statistically significant independent variable.
In the case of CR, statistically reliable regression models are created where the explanatory part of the dependent variable is 95.90% (R2 = 0.96), but, with four independent variables, 97.70% (R2 = 0.98) is obtained. In the model of five independent variables, or the 1st regression model, the largest and statistically significant effect on the result value has NuC whose β coefficient is 0.84, but, in the 2nd regression model, it is ValAdd whose β coefficient is 0.92. According to both equations, it is possible to calculate the dependent variable with high explainability, but each regression model has a different statistically significant independent variable.
Taking into account the fact that data on the independent and dependent variables for 2020 are still not available, forecasts for the variables for 2020–2022 were developed by using data for the period from 2010 to 2019.
When developing the forecasts of the independent variables for 2020–2022, it was not possible to create forecast models for two independent variables – GrMargGS and GrInTG – because both independent variables do not have a close, statistically significant correlation with the other independent variables. The forecasts for the independent variables ValAdd and PerCosts were made for the next 3 years with high explainability (see Figures 1 and 2), but the explainability was moderate in the case of four variables (R2>0.7, but below 0.85), which means that the forecast does not have a sufficiently high explainability and significance. It can be used to assess possible trends, but not accurate forecasts.
Table 5. Regression equations of the dependent variables
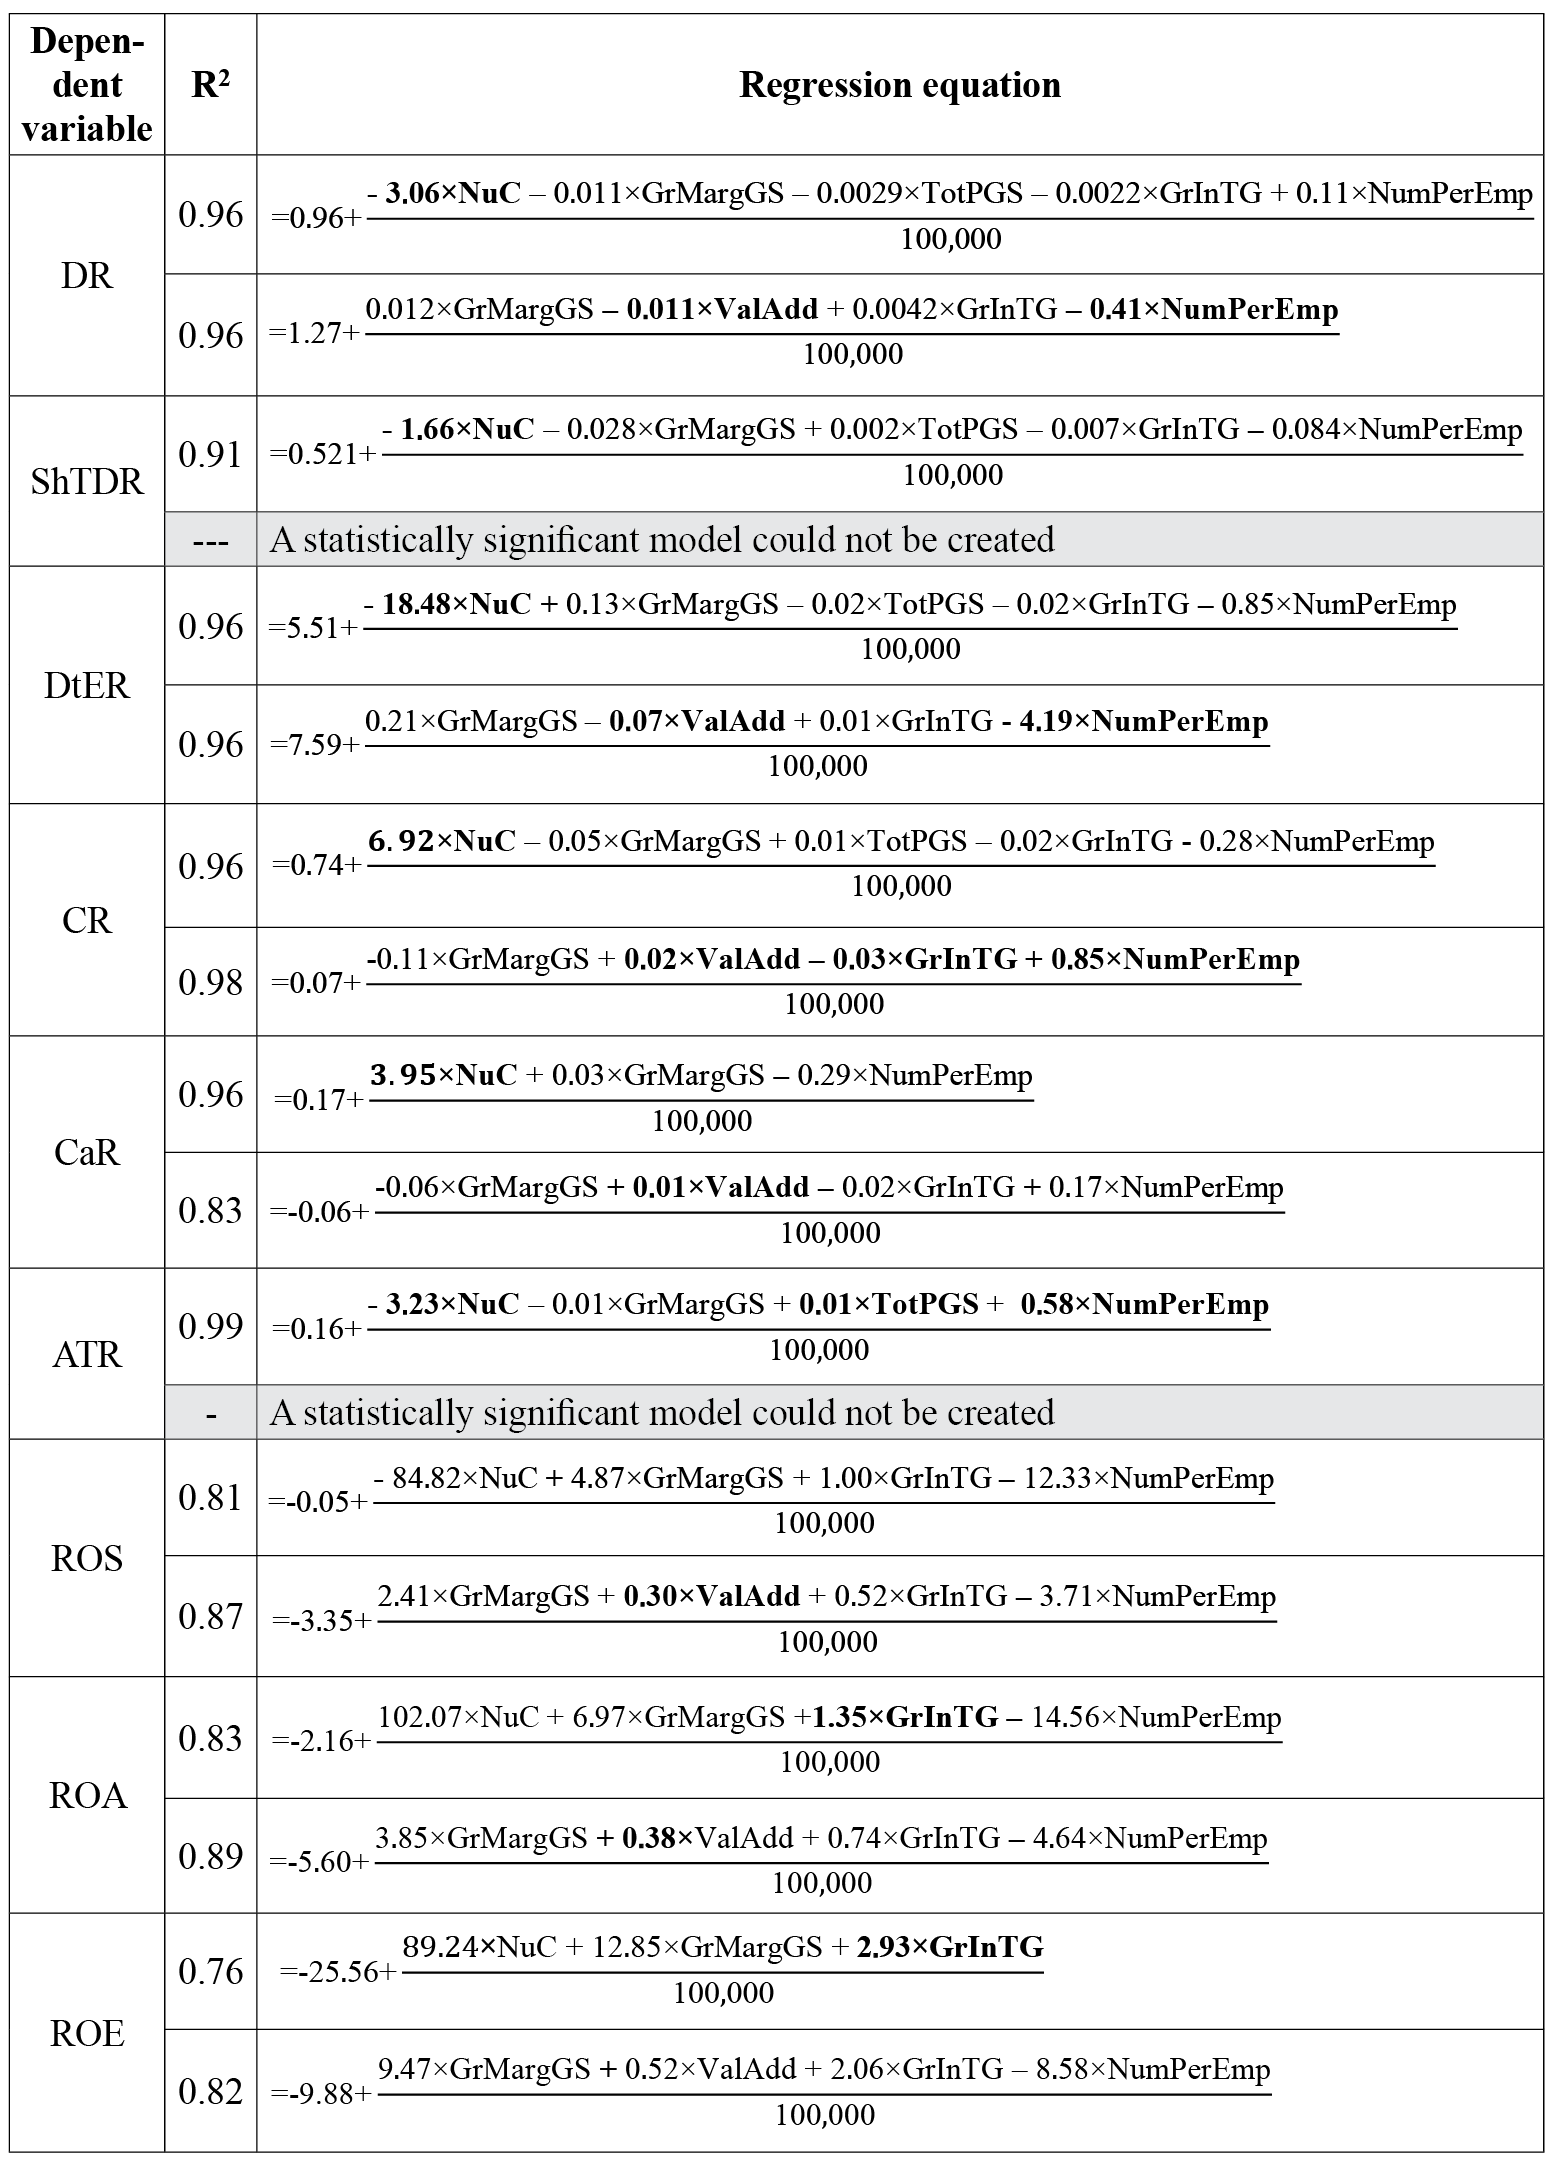
Values in bold have a statistically significant p <0.05 significance in the particular regression analysis
Source: the authors’ calculations are based on the official statistics of LOSP
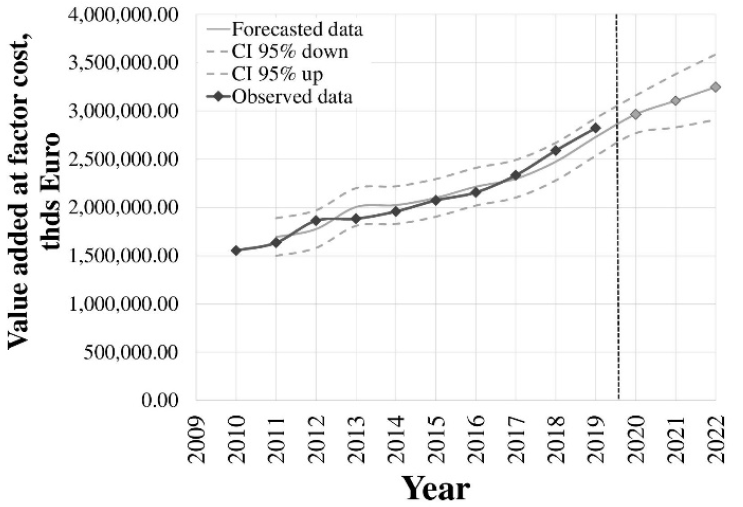
Figure 1. Forecasts of the independent variable Value Added (ValAdd) for 2020–2022
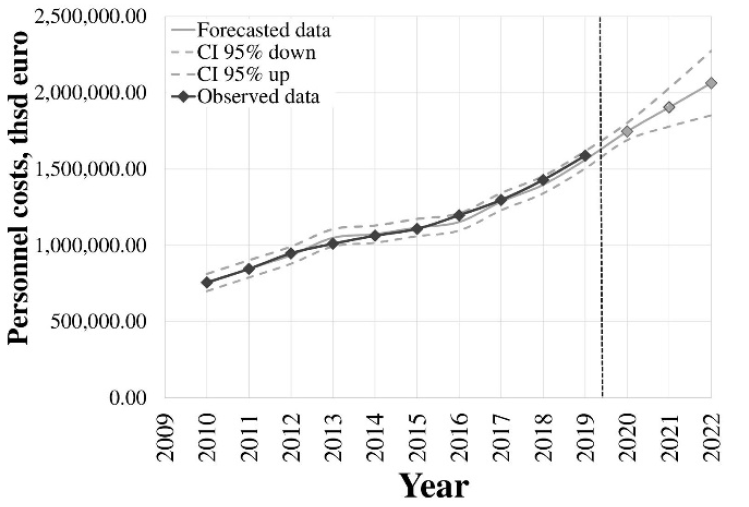
Figure 2. Forecasts of the independent variable Personnel costs (PerCosts) for 2020–2022
Source: the authors’ calculations are based on the official statistics of LOSP
The forecasts of the independent variables ValAdd and PerCosts for the next three years show a tendency for both variables to increase (Figures 1 and 2).
When developing the forecasts of the dependent variables for 2020–2022, it was found that only two dependent variables – DR and CR – can be forecasted with high significance or explainability for the next three years (Figures 3 and 4).
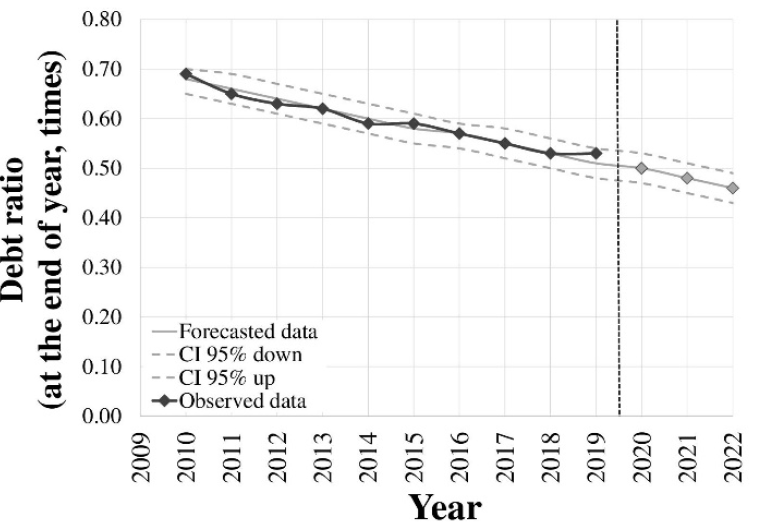
Figure 3. Forecasts of the dependent variable Debt ratio (DR) for 2020–2022
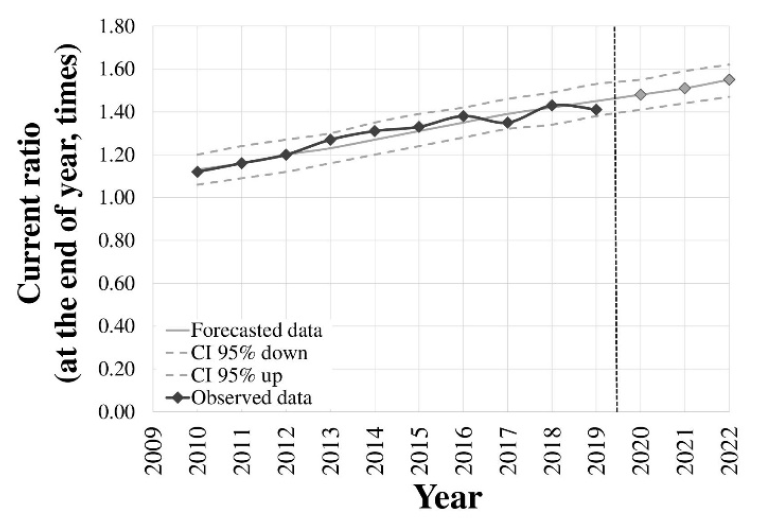
Figure 4. Forecasts of the dependent variable Current ratio (CR) for 2020–2022
Source: the authors’ calculations are based on the official statistics of LOSP
The forecasts of the dependent variables DR and CR for the next three years show a declining trend of DR and an increasing trend of CR.
5. Discussion and Concluding Remarks
As a result of the research, the authors concluded that the external evaluation of companies’ performance in Latvia can be performed by using only financial indicators. In Latvia, information on corporate finances can be found in three institutions – LOSP, Lursoft Ltd., and the CrediWeb portal – which use three identical financial ratios for the financial analysis of companies: the current ratio, the debt ratio/equity ratio, and the return on assets.
In the research, experts unanimously recognized the following financial ratios as the most important financial ratios in evaluating the performance of manufacturing companies: return on sales (ROS), return on equity (ROE), gross profitability, accounts receivable turnover, days, return on assets (ROA), payables turnover, days, and inventory turnover, days.
The authors of the article revealed the statistically significant correlation between the financial analysis indicators of manufacturing enterprises and the main business indicators of manufacturing enterprises based on the publicly available data of LOSP for the period from 2010 to 2019. The results of this study allow managers of manufacturing companies to assess the relationships between financial analysis indicators and key business indicators in the industry as a whole and to compare them with the performance indicators of specific companies. The practical applicability of the study results would be enhanced by the possibility of conducting the study over a longer period of time, for example, if the data were available on a quarterly basis and if the data were available by the enterprise category. Such a study could be particularly relevant for SMEs, as, in the opinion of Nogning and Gardoni (2017), according to the Web of Science database, only 0.5% of performance measurement studies are targeted at SMEs.
Upon assessing the statistically significant correlations between the financial analysis indicators of manufacturing enterprises (the dependent variables) and the main business indicators of manufacturing enterprises (the independent variables), it was concluded that 100% correlation was observed between sales profitability and return on assets, but at least close and statistically significant correlations with other dependent variables were not observed for the turnover ratio of all assets. For the independent variables, 100% correlation was observed between the two pairs of independent variables, Personnel Costs vs. Value Added vs. Turnover and Production Value. For the independent variables, Gross investment in tangible goods does not have a statistically significant correlation with any other independent variables, which indicates the independence of this indicator from the other independent variables.
The study used indicators that are timeline data; moreover, all indicators are time-dependent, or their variability is related to the time period. Accordingly, these indicators were analyzed both by maintaining the existing time relationship and by differentiating it into time-independent indicators.
From the obtained results, we can conclude that there are five main pairs of business indicators of manufacturing companies which exhibit close or very close correlation with each other regardless of the time period: Production value and Turnover; Total value of purchases of goods and services and Turnover; Total value of purchases of goods and services and Production value; Gross margin on goods for resale; and Value added and Staff costs and Value added. This means that, regardless of what happens in a given period of time, these indicators change in close correlation and make it possible to assess the changes in the respective indicators.
It was determined whether correlation between dependent and independent variables exists. Four regression analyses are possible: Liabilities in the balance sheet, Liabilities to equity, Total liquidity, and Turnover of total assets. In addition, the Turnover of all assets correlates with all three variables – Production value, Turnover and Total value of purchases of goods and services – which are interrelated. By using the transformed indicators, four regression equations were obtained which can be used regardless of time.
Regression equations or models were developed on the basis of data characterizing the manufacturing industry in the country as a whole or the industry averages. It would be desirable to continue this study and to examine in the future studies whether the above-mentioned regression equations or models are also applicable to individual companies, including companies of different categories.
Upon analyzing all the variables, it can be concluded that they are all time-dependent variables, so the generated regression models can be used when only taking into account this fact. By concluding that regression models with several variables characterizing companies could be created only by maintaining the time dependence or the existence of a trend, we can also conclude that the relationship between the dependent and independent variables is also only related to time. Such regression models could also be used in the future to predict performance in companies, but with additional testing beforehand.
In future studies, it may be useful to estimate changes in the independent variables or deltas over the years (in terms of value and percentage) in relation to the dependent variables. This type of a data regression model could be used in enterprises if changes (increases or decreases) in several independent variables are predicted. It could be tried to predict changes (increases or decreases) in dependent variables.
As a result of multifactorial regression, two regression models for the dependent variables have been developed. The following independent variables were common to the following regression models: gross margin on goods for resale, gross investment in tangible goods and number of persons employed.
Taking into account the fact that data on the independent and dependent variables for 2020 are still not available, forecasts for the variables for 2020–2022 were developed by using data for the period from 2010 to 2019. The forecasts for the independent variables Value Added and Personnel Costs were made for the next three years with high explainability, and the forecasts showed a tendency for both variables to increase. The forecasts for the dependent variables Debt Ratio and Current Ratio were developed for the next three years with high explainability, and the forecasts showed a declining trend of the Debt Ratio and an increasing trend of the Current Ratio.
In order to identify and evaluate the significance and role of the financial indicators and to successfully solve the problems of financial management of companies, it is necessary to develop a unified system of the financial indicators for business performance evaluation.
In the near future, financial analysis indicators and key business indicators of Latvian manufacturing companies for 2020 will be available, and it will be the first opportunity to test the accuracy of regression models with and without time dependence, as well as to develop sufficiently high precision forecasts.
References
Ahmad, N. N., & Jamil, N. N. (2020). Measuring the Financial and Nonfinancial Performance of Micro-Enterprise in Pahang, Malaysia. International Journal of Academic Research in Business and Social Sciences, 10(10), 706–717.
Alomar, M., & Pasek, Z.J. (2015). A Performance Improvement and Management Model for Small and Medium Sized Enterprises. In: Pinson E., Valente F., Vitoriano B. (eds.) Operations Research and Enterprise Systems. ICORES 2014. Communications in Computer and Information Science, 509, Springer, Cham. https://doi.org/10.1007/978-3-319-17509-6_6
Alshehhi, A., Nobanee, H., & Khare, N. (2018). The Impact of Sustainability Practices on Corporate Financial Performance: Literature Trends and Future Research Potential. Sustainability, 10(2), 494. https://doi.org/10.3390/su10020494
Asiaei, K., Rezaee, Z., Bontis, N., Barani, O., & Sapiei, N.S. (2021). Knowledge assets, capabilities and performance measurement systems: a resource orchestration theory approach. Journal of Knowledge Management, 25(8), 1947–1976. https://doi.org/10.1108/JKM-09-2020-0721
Baird, K. (2017). The effectiveness of strategic performance measurement systems. International Journal of Productivity and Performance Management, 66(1), 3–21. https://doi.org/10.1108/IJPPM-06-2014-0086
Bititci, U.S., Garengo, P., Ates, A., & Nudurupati, S.S. (2015). Value of maturity models in performance measurement. International Journal of Production Research, 53(10), 3062–3085. https://doi.org/10.1080/00207543.2014.970709
Borhan, H., Naina Mohamed, R., & Azmi, N. (2014). The impact of financial ratios on the financial performance of a chemical company: The case of Lyondell Basell Industries. World Journal of Entrepreneurship, Management and Sustainable Development, 10(2), 154–160. https://doi.org/10.1108/WJEMSD-07-2013-0041
Central Statistical Bureau (2021). Statistics by theme. Available at https://www.csb.gov.lv/en/statistics/statistics-by-theme/enterprises Accessed: 30 December 2021).
Costa Ferreira Junior, S., & Fleury, A.C.C. (2018). Performance assessment process model for international manufacturing networks. International Journal of Operations & Production Management, 38(10), 1915–1936. https://doi.org/10.1108/IJOPM-03-2017-0183
CrediWeb portal (2021). Sample of the short report. Available at https://www.crediweb.lv/about/services/sample/short_en.pdf (Accessed: 14 November 2021).
Endrikat, J., Guenther, T.W., & Titus, R. (2020). Consequences of strategic performance measurement systems: a meta-analytic review. Journal of Management Accounting Research, American Accounting Association, 32(1), 103–136. https://doi.org/10.2308/jmar-52575
Fatihudin, D., Jusni, & Mochklas, M. (2018). How Measuring Financial Performance. International Journal of Civil Engineering and Technology, 9(6), 553–557.
Hristov, I., Appolloni, A., Chirico, A., & Cheng, W. (2021). The role of the environmental dimension in the performance management system: A systematic review and conceptual framework. Journal of Cleaner Production, 293, 126075. https://doi.org/10.1016/j.jclepro.2021.126075
Jasti, N.V.K., & Kodali, R. (2016). An empirical study for implementation of lean principles in Indian manufacturing industry. Benchmarking: An International Journal, 23(1), 183–207. https://doi.org/10.1108/BIJ-11-2013-0101
Kasjanovs, I. (2015). Latvijas apstrādes rūpniecība šķērsgriezumā. Available at: https://www.makroekonomika.lv/latvijas-apstrades-rupnieciba-skersgriezuma (Accessed: 14 November 2021)
Kendall, M.G. (1955). Rank Correlation Methods. New York, Hafner Publishing Co.
Khalfallah, M., & Lakhal, L. (2021). The impact of lean manufacturing practices on operational and financial performance: the mediating role of agile manufacturing. International Journal of Quality & Reliability Management, 38(1), 147–168. https://doi.org/10.1108/IJQRM-07-2019-0244
Kotane, I. (2016). Practice of small and medium-sized enterprise performance evaluation in Latvia. Proceedings of the International Scientific Conference. SOCIETY. INTEGRATION. EDUCATION, IV, 335–344. http://dx.doi.org/10.17770/sie2016vol4.1570
Kotane, I., & Kuzmina-Merlino, I. (2017). Analysis of small and medium sized enterprises’ business performance evaluation practice at transportation and storage services sector in Latvia. Procedia Engineering, 178, 182–191. https://doi.org/10.1016/j.proeng.2017.01.093
Le Thi Kim, N., Duvernay, D., & Le Thanh, H. (2021). Determinants of financial performance of listed firms manufacturing food products in Vietnam: regression analysis and Blinder–Oaxaca decomposition analysis. Journal of Economics and Development, 23(3), 267–283. https://doi.org/10.1108/JED-09-2020-0130
Lursoft Ltd. (2021). Financial analysis. Available at https://www.lursoft.lv/en/financial-analysis Accessed: 14 November 2021).
Mashovic, A. (2018). Key financial and nonfinancial measures for performance evaluation of foreign subsidiaries. Journal of Contemporary Economic and Business Issues, 5(2), 63–74.
Midovska-Petkoska, M., Boshkoska-Klisaroski, M., & Mancheski, G. (2020). Challenges for successful implementation of Performance measurement system – case study food industry in the Republic of Macedonia. ILIRIA International Review, 10(1), 35–46.
Midovska-Petkoska, M., Odzaklieska, D., & Lazaroski, S. (2019). Designing an Integrated Framework for Measuring Organizational Performance in the Companies of the Food Industry in the Republic of North Macedonia. Proceedings of the 24th International Scientific Conference Strategic Management and Decision Support Systems in Strategic Management. https://doi.org/10.46541/978-86-7233-380-0_52
Ministry of Economics of the Republic of Latvia (2021). Macroeconomic Review of Latvia. October 2021. Available at https://www.em.gov.lv/en/media/12426/download (Accessed: 14 November 2021).
Nogning, F.L., & Gardoni, M. (2017). Double performance prism: Innovation performance measurement systems for manufacturing SMEs. International Journal of Innovative Research in Advanced Engineering, 4(3), 113–128.
Official Statistics Portal (2021). Statistical database. Available at https://data.stat.gov.lv/pxweb/en/OSP_PUB/ (Accessed: 14 November 2021).
Paladi, I., & Fenies, P. (2016). Performance Management in Central and Eastern European Countries: A Literature Review, Performance Measurement and Management Control: Contemporary Issues Studies in Managerial and Financial Accounting, 31, 215–271. https://doi.org/10.1108/S1479-351220160000031008
Sahlin, J., & Angelis, J. (2019). Performance management systems: reviewing the rise of dynamics and digitalization. Cogent Business & Management, 6(1), 1642293. https://doi.org/10.1080/23311975.2019.1642293
Seo, Y.W., & Lee, Y.H. (2019). Effects of internal and external factors on business performance of start-ups in South Korea: the engine of new market dynamics. International Journal of Engineering Business Management, 11(4), 1–12. DOI: 10.1177/1847979018824231
Smith, M., & Bititci, U.S. (2017). Interplay between performance measurement and management, employee engagement and performance, International Journal of Operations & Management, 37(9), 1207–1228. https://doi.org/10.1108/IJOPM-06-2015-0313

The research was elaborated with of EU ESF project no. 8.2.2.0/20/I/005 “To strengthen the Academic Staff of Rezekne Academy of Technology, Ventspils University of Applied Sciences and Vidzeme University of Applied Sciences in the fields of strategic specialization” financial assistance