Ekonomika ISSN 1392-1258 eISSN 2424-6166
2022, vol. 101(1), pp. 37–61 DOI: https://doi.org/10.15388/Ekon.2022.101.1.3
Financial Inclusion, Poverty, and Income Inequality: Evidence from European Countries
Driss Tsouli
Vocational training institute, OFPPT, Morocco
Email: Tsouli.driss@gmail.com
Abstract. This study contributes to the existing literature on financial inclusion by examining the determinants of financial inclusion and studying the impact of financial inclusion on poverty reduction and income inequality in European countries. We investigate the impact of financial inclusion on poverty and income inequality in 30 European countries during 2004-2019 based on a composite financial inclusion index (FII) constructed by using principal component analysis (PCA). Then we assess the impact of financial inclusion, on poverty and income inequality, by employing the fixed effect method. The estimates reveal that, for the European countries, GNI per capita, population density, inflation, and internet users have a positive and significant impact on financial inclusion across all the regressions. Rule of law has a positive impact on financial inclusion, and the age dependency ratio has a negative impact on financial inclusion. The findings also indicate that financial inclusion is significantly correlated with lower poverty for the full sample. Lastly, the present study supports the role of financial inclusion in reducing income inequality in European countries.
Keywords: Financial inclusion; Income level; Inequality; Poverty; Panel data
_________
Received: 19/11/2021. Revised: 08/02/2022. Accepted: 12/02/2022
Copyright © 2022 Driss Tsouli. Published by Vilnius University Press
This is an Open Access article distributed under the terms of the Creative Commons Attribution License, which permits unrestricted use, distribution, and reproduction in any medium, provided the original author and source are credited.
1. Introduction
Billions of people across the world are in need to use financial services to reach even modest levels of financial wellbeing. In emerging markets, many households and small businesses have limited access to formal financial services. Even in developed countries, they can only benefit from a limited set of costly products from financial institutions, and do not have access to diversified investment and savings options, low-cost payments systems, core household and business insurance, or credit1. Financial inclusion is not an end in itself but a tool to an end. It is widely recognized as crucial to alleviating poverty and attaining financial well-being. According to the United Nations’ Sustainable Development Goals, financial inclusion contributes to increase resilience and capture economic opportunities for households and informal economies. In this perspective, financial inclusion has been recognized as a fundamental pillar of sustainable growth, income equality, and poverty reduction for all the regions in the world. Financial services help individuals escape poverty by making easier the investment in education, business, and health, especially with the use of digital services, including payment cards, mobile money, and other applications of financial technology (FinTech). That is why, in 2012 the world bank urged policymakers to facilitate and improve access to financial services around the world. In response, recent years have witnessed significant efforts by policymakers and the international community to make access to financial services more affordable and easier, especially for those excluded from the formal financial sector (Asuming et al., 2019). According to the Financial Access Survey Results2 released by the international monetary fund (IMF) in 2019 , the number of countries reporting mobile money data increased from 35 to 47, and, for example, a country like Afghanistan where less than 20 percent of adults have bank accounts, the value of mobile money transactions has increased by four times to reach 1.2 percent of GDP in 2018.Therefore, the number of commercial bank branches globally may be a result of the decline in the number of commercial bank branches in advanced economies of Europe. This is an indication of a move transition toward another channel of financial access and internet banking. However, the growth in mobile and internet banking is not limited to advanced economies but it is actually a worldwide phenomenon. For example, in Mongolia, the volume of mobile and internet banking transactions has grown fourfold from 2008 to 2015. Financial inclusion is connoted as all initiatives that ensure the accessibility, availability, and usage of formal financial services for all individuals of an economy (Sarma & Pais 2008). On the other hand, it is important to point out that there are several forms of financial exclusion. For that, the world bank report (World Bank 2014) has identified four main forms of financial exclusion which are classified into voluntary and involuntary exclusion. Voluntary exclusion is a condition where a fraction of the population or firms prefer not to use financial services due to religious or cultural reasons. On the contrary, involuntary exclusion emerges from poverty conditions: insufficient income, high-risk profile, gender discrimination, lack of information, or price barriers due to market imperfections. From the macroeconomic perspective, efforts of policymakers must be oriented toward involuntary exclusion by designing appropriate policies and programs to improve the market conditions (remove price barriers, provide information, and equity).How important is financial inclusion in explaining poverty reduction and income inequality across countries? Recent literature on the impact of finance on poverty and income inequality has focused on the impact of financial inclusion across countries. This literature has found evidence that financial inclusion significantly reduces poverty rates and income inequalities. (C. Y. Park & Mercado 2018; Huang et al., 2021; Churchill & Marisetty 2020; Inoue 2019; Omar & Inaba 2020). Even though some studies do not find positive results, they still often indicate the possibility of reaching better results through particular attention to the local conditions (Demirgüç-Kunt et al., 2020).A challenge in this research is to investigate the impact of financial inclusion from a regional perspective. Several recent studies have taken up the question concerning regions (Chu Khanh 2019; Omar and Inaba 2020; Huang et al., 2021). All these papers use the income level as a criterion within a region (Y. Huang & Zhang 2020) or between some specific regions (Omar & Inaba 2020).To the best of our knowledge, few studies compare the impact of financial inclusion based only on income level (Demir et al., 2020; Khanh Chu 2019), as most of the studies compare a specific region with the world by using income level as a control variable. In this research, we seek to assess the impact of financial inclusion on poverty reduction and income inequality while focusing on European countries. Therefore, we pose two simple questions: first, what are the critical factors that influence financial inclusion in the European countries? Second, is poverty and income inequality reduced by financial inclusion in the European countries? This research contributes to the currently available literature on financial inclusion: first, by constructing a novel finance inclusion index based on a multidimensional approach and the PCA method (Cámara and Tuesta 2017; Nguyen 2020), by sampling 30 European countries and spanning the period of 2004 - 2019. Second, by identifying the critical factors of financial inclusion and analyzing the impact of financial inclusion on poverty reduction and income inequality. Third, by assessing the relationship between financial inclusion and poverty and income inequality. By using our financial inclusion index, we examine the determinants that affect financial inclusion. The estimates show that, for the European countries, GNI per capita, population density, inflation, and internet users have a positive and significant impact on financial inclusion across all the regressions, and they are consistent with the findings in the literature. The rule of law has a positive impact on financial inclusion, and the age dependency ratio has a negative impact on financial inclusion. For the Impact of financial inclusion on poverty reduction, the results indicate the negative relationship between financial inclusion and poverty rates for the European countries. Moreover, education decreases poverty as it provides people skills to integrate the labor market and consequently to earn an income. On the other side, Income distribution measured by the GINI index shows a highly significant negative effect on poverty reduction. In addition, inflation reduces poverty in European countries and it can be illustrated by the fact that inflation encourages rich people to invest their saving into real capital expenditures, and, consequently, create more jobs that provide them an income and thereby decrease poverty. But the combination of GNI per capita and financial inclusion index has no impact on poverty reduction. This does not confirm the assumption that associating financial inclusion with a higher income level probably contributes to the reduction of the poverty rate. Concerning the Impact of financial inclusion on income inequality, our findings indicate that there is a highly significant correlation between the level of financial inclusion and income inequality. This paper is presented as follows: Section 2 contains related literature review. Section 3 reveals data and methodology. Section 4 presents findings and discussions and Chapter 5 concludes with some policy implications.
2. Literature review
2.1. Concept and measurement of financial inclusion
Financial inclusion is progressively being admitted as a crucial instrument for tackling poverty and promoting the growth of nations. However, there is no consensus about the concept of financial inclusion. Previous studies have taken up this concept in several ways, depending on the socio-economic context. For example, financial inclusion is defined as a situation where people and businesses have access to basic and affordable financial services (Amidzic et al., 2017; World Bank 2014; Demirguc-Kunt et al., 2017). In addition, Cámara and Tuesta (2017) highlight that financial inclusion is the maximization of usage and access from the financial system, and the minimization of involuntary financial exclusion. From a practical approach, financial inclusion should be defined through its dimensions Cámara & Tuesta (2014). For that, Sarma (2016) views financial inclusion as a process to ensure the ease of access, availability, and use of formal financial services for all sectors of the economy. Therefore, in our research, we adopt Sarma’s definition, which includes three dimensions namely: accessibility, availability, and usage, which shall be presented and discussed below. The lack of an appropriate measurement of financial inclusion complicates the understanding of its relationship with other factors. What regards the definition of financial inclusion, the literature does not provide any robust method for measuring or assessing financial inclusion in an economy or a region. In the existent literature on the measurement financial inclusion measurement, two methods are used: (1) a method based on a set of indicators (regrouped by dimensions) and (2) a method based on single indicators. To the best of our knowledge, the paper of Beck, Demirguc-Kunt, and Martinez Peria (2007) was the first attempt at measuring banking access for three financial services(lending, payment, and deposits) using two dimensions: access and use of financial services. Honohan (2008) measured the financial service’s accessibility by integrating data on account numbers (the number of bank accounts and the bank deposit size) with surveys data of the proportion of the adults that use formal financial intermediaries (banks and microfinance institutions). Unlike Honohan (2008), Sarma (2008, 2016) and (Cámara & Tuesta 2014) developed a multidimensional financial index, because the concept of financial inclusion is also dimensional and it cannot be apprehended by single indicators (Cámara & Tuesta 2014). Furthermore, these indicators when used alone, provide incomplete and partial information about the financial system and a misunderstanding about the level of financial inclusion in an economy (Nguyen 2020; Sarma & Pais 2008).Many perspectives have been used when trying to identify a congruous measurement called the FI index to widely assess the sphere of the financial system. From an institutional perspective, the International Monetary Funding (IMF) Financial access survey has constructed a financial index based on several indicators such as the number of automatic teller machines (ATMs), the number of banks branches, the number of deposit accounts, and outstanding deposits or loans. Since 2014, the World Bank has been providing through its database Global Findex a large set of indicators on financial inclusion related to the number of accounts and the use of financial services, also provides information about education, income, gender, and age. We also report that Financial Inclusion Insights (FII) Program was conceived in 2013 in partnership with the Bill and Melinda Gates Foundation to create knowledge about financial inclusion in thirteen countries across Africa and Asia, and it constructs various indicators such as mobile phone access and ownership, mobile money, digital inclusion, financial behavior, financial literacy, etc. Also, we indicate that the approach of computing the human development index implemented by the United Nations Development Program was useful for constructing a financial inclusion index by several papers. The backbone of all studies developed about a multidimensional financial inclusion measurement is the study of Sarma (2008, 2016) who computed the sub-index of each dimension and aggregated each index as the normalized inverse of the Euclidean distance, where the distance is calculated from a reference point and normalized by the number of dimensions included in the composite index. The weighting is assigned to dimensions based on the author’s intuition (for accessible, usable, and used, these are 1, 0.5, and 0.5, respectively). Following that, several papers have developed a financial inclusion index (Wang and Guan 2017; Park and Mercado 2018; Sethi and Sethy 2019; Omar and Inaba 2020; Huang and Zhang 2020). These studies provide a more appropriate measurement of the financial inclusion level than the studies using single indicators for measurement. Yet the weights assigned for each dimension are subjectively chosen and based on the researcher’s experience(Cámara & Tuesta 2014), and a small change in weights can modify the results considerably (Lockwood, 2004). Subsequently, the lack of a rigorous approach based on a scientific foundation, made this approach highly criticized by the academic community. In this context, Amidžić et al. (2014) constructed a financial inclusion index using Factor Analysis (FA) to determine dimensions and weights. Cámara & Tuesta (2014), applied two-stage Principal Component Analysis (PCA) for the construction of a multidimensional financial inclusion index. Subsequently, several papers have followed Cámara & Tuesta (2014) and Amidžić et al. (2014) to construct a multidimensional financial inclusion index (Lenka & Bairwa 2016; Mialou et al., 2017; Yorulmaz 2018; Datta & Singh 2019; Nguyen 2020; Tram et al., 2021). In this paper, we also follow the PCA method recommended by Cámara & Tuesta (2014).
2.2. Determinants of financial inclusion
As previously indicated, the determination of critical factors of financial inclusion is a must, especially with the economic disparities across regions and nations. The literature on determinants of financial inclusion has identified two forms of determinants: micro-level factors and macro-level factors. For the micro-level factors, several studies have found that variables such as income level, gender education, and age are the critical determinants. A study conducted by Zins & Weill (2016) for a sample of 37 African countries found that people who are rich, older, male and educated have more access to financial services. In addition, a study by Allen et al. (2016), which covered 123 countries and over 124,000 individuals, indicates that young, poor, and those from rural areas are more financially excluded, and suggests that the enhancement of lower account costs, proximity to financial institutions, a legal right, and political stability are associated with a high level of financial inclusion. Similarly, a study by Khanh Chu (2019) using the data of 150,000 adults from 144 countries, corroborates that male gender, level of education, the income level, the occupation, and the age increase access to financial services. Another study by Ghosh & Vinod (2017) in India using the data of 110,800 households, found that households led by females are 8% less likely to have access to financial services and they use 20% fewer cash loans compared to the households led by males. it highlighted that females with a low level of education and low wages are deprived of financial services. The study of Mohammed et al. (2017) pointed out that people who are advanced in age are more able to reduce poverty if they have access to financial services while females are more financially excluded. By using data across 18 countries of Central and West Africa with 18,000 observations, Soumaré et al. (2016) indicate that access to financial services is driven by income level, education, gender, employment status, household size, marital status, and trust in financial intermediaries. Other strands of the literature identified the macro-level factors that explain the micro-level factors. In this context, C. Y. Park & Mercado (2018) noted that the per capita income, rule of law, and demographic characteristics significantly influence financial inclusion for both the entire world and Asian countries. Similarly, a study on developing countries by Omar & Inaba (2020) also found that per capita income, the ratio of internet users, age dependency ratio, inflation, and income inequality significantly influence the level of financial inclusion in the developing countries. Moreover, Asuming et al. (2019) suggest that macroeconomic variables such as the growth rate of GDP, the availability of financial institutions, and an environment of Business Freedom are determinants for financial inclusion. By focusing on 15 African countries from 2005 to 2014, Evans & Adeoye (2016) find that internet access, literacy, per capita income, broad money3, and Islamic banking institutions are key determinants of financial inclusion in Africa.
2.3. Linkages between financial inclusion, poverty reduction,
and income inequality
To date, the literature on the impact of financial inclusion on poverty reduction, and income inequality covers this topic in a relatively limited way perhaps due to the availability of data for a long-spanning period and an important number of missing data related to financial inclusion. Consequently, only a few papers, and with mixed results have studied the impact of financial inclusion on poverty and income inequality. Neaime and Gaysset (2018) highlight the importance of financial inclusion to reduce poverty and income inequality by using a sample of 8 MENA economies from 2002 to 2015, measuring financial inclusion through the number of Automatic Teller Machines (ATMs) per 100,000 adults and commercial banks per 100,000 adults. Income inequality was measured by the GINI index, and poverty was assessed by using the log difference of the poverty headcount ratio at national poverty lines. The results suggest that a high number of banks can facilitate access for the poor to financial services and eventually diminish the income inequality. Also, the authors conclude that an increase in inflation impacts negatively the purchasing power, and, subsequently, the individual income which therefore intensifies poverty. In a parallel study, Omar and Inaba (2020) have shown that financial inclusion reduces poverty rate and income inequality for 116 developing countries from three regions in the world: Asia, Africa, and Latin America. They measured financial inclusion multi-dimensionally based on three dimensions, and each dimension has two variables. The weight of each dimension was intuitively computed. Ouechtati (2020) studied the impact of financial inclusion on income inequality and poverty for 53 developing countries from 2004 to 2017. Financial inclusion was measured by four variables: Automated teller machines per 100,000 adults, bank branches per 100,000 adults, commercial bank borrowers per 1,000 adults, and commercial bank deposit accounts per 1,000 adults. As well as in the previous studies, poverty and income inequality were measured respectively by the poverty headcount ratio and the GINI index. The results revealed that the availability of credit and access to deposit accounts at commercial banks significantly reduce the poverty. Moreover, it was concluded that a high level of bank penetration and access to credit can alleviate income inequality. The study of C. Y. Park and Mercado (2018), investigated the influence of financial inclusion in reducing poverty and income inequality for 176 economies with a comparison between the world and the region of Asia. The findings highlight that financial inclusion is significantly correlated with lower poverty and income inequality levels for the world sample. Yet, for Asian countries, there is no relationship between financial inclusion and income inequality. Similarly to C. Y. Park and Mercado (2018), a study of RATNAWATI (2020) found no impact of financial inclusion on the poverty reduction and income inequality for a sample of 10 Asian countries. Kim (2016) assessed the impact of financial inclusion on income inequality while focusing on forty countries members of the European Union (EU) and the Economic Co-operation and Development (OECD) from 2004 to 2011. The results suggest that financial inclusion contributes to reducing inequality in low-income countries only. In contrast, for the entire sample financial inclusion plays the role of a mediator for changing the negative relationship between income inequality and economic growth to a positive relationship. In an early study, Mookerjee and Kalipioni (2010) examined the relationship between financial access and income inequality for 70 developed and developing economies, spanning across the period 2000 - 2005. The findings indicate that the increasing access to financial services reduces income inequality. By using a sample of 62 countries covering the period 2001 - 2012, Mushtaq & Bruneau (2019) focused on two dimensions of financial inclusion (Inclusion by commercial banks and by microfinance institutes). A partial result of this study found that a high level of financial inclusion corresponds to a low level of poverty and income inequality. A recent study by Churchill & Marisetty (2020) evaluated the impact of financial inclusion on reducing poverty for 45000 households across 12 countries. The results enhance the hypothesis that financial inclusion has a strong poverty-reducing effect. In the light of the above listed arguments, it is clear that the impact of financial inclusion on reducing poverty and income inequality is not yet clarified and it depends on the contexts of each group of countries. The contradictory results can be explained by the fact that research samples differ, various indicators reflecting financialization are used, and different independent variables are included in the regression equations (Diliuvienė & Tamašauskienė, 2021). This study adds some evidence to the literature by studying the European countries and investigating the possible relationships with financial inclusion.
3. Data and methods
Based on previous studies, this study is conducted to examine whatever role the financial inclusion can play in reducing poverty and income inequality. For that, we first construct our financial inclusion index.
3.1. Data description and sources
The data were collected through two sources. The first set of variables consists of the indicators related to the financial inclusion index (FII) which is sourced from the Financial Access Survey of International Monetary Fund (FAS-IMF), whereas the second set of variables contains indicators from the World Development Indicators (WDI) database of the World Bank (WDI) (Table 1). All the variables were selected from the literature review. The analysis uses 16 years of unbalanced annual panel data covering the period from 2004 to 2019 for 30 European countries4. Due to the heterogeneity variables scale, we have employed the logarithm for all variables (except for the rule of law) for improving the robustness of our empirical analysis. We also indicate that the missing data for some variables were treated by the linear interpolation method, for the simple reason that observations do not have high volatility within each group of the panel data.
3.2. Model specification
In our empirical analysis, we ran our models based on three regression techniques (Fixed Effect, random effect, and GMM). First, we estimate which factors determine the financial inclusion for our sample. Following (Honohan 2008; Omar & Inaba 2020; C. Y. Park & Mercado 2018) the log value was used for all the variables in the model except for the variable Rule of law.
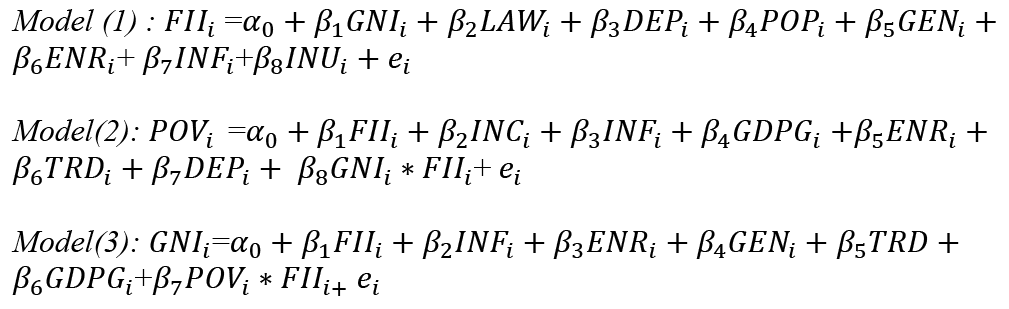
Table 1. Description of variables and Data sources
|
Variables |
Description |
Data sources |
|
|
Financial Inclusion Index (FII) Computed with PCA method |
Branches |
Number of commercial banks, credit union per 100,000 adults |
FAS- IMF |
|
ATMs |
Number of Automated Teller Machines (ATMs) per 100,000 adults |
FAS- IMF |
|
|
Deposit |
Outstanding deposits with commercial banks, (% of GDP) |
FAS- IMF |
|
|
Loans |
Outstanding loans from commercial banks, * (% of GDP) |
FAS- IMF |
|
|
GNI per capita (GNI) |
GNI per capita is the gross national income, converted to U.S. dollars using the World Bank Atlas method, divided by the midyear population. |
WDI |
|
|
Rule of law (LAW) |
It is a detailed and comprehensive picture of the extent to which countries adhere to the rule of law in practice where 1 signifies the highest score and 0 signifies the lowest score. |
WDI |
|
|
Age Dependency Ratio (DEP) |
Age dependency ratio is the ratio of dependents-people younger than 15 or older than 64 to the working-age population--those aged 15–64. Data are shown as the proportion of dependents per 100 working-age population. |
WDI |
|
|
Population Density (POP) |
Population density is midyear population divided by land area in square kilometres. |
||
|
School Enrolment (ENR) |
It is the ratio of total enrolment, regardless of age, to the population of the age group that officially corresponds to the level of education shown. |
WDI |
|
|
Income Distribution (INC) |
GINI index measures the extent to which the distribution of income among individuals or households within an economy deviates from a perfectly equal distribution. The GINI index of 0 represents perfect equality, while an index of 100 implies perfect inequality. |
WDI |
|
|
Inflation (INF) |
Inflation, as measured by the consumer price index, reflects the annual percentage change in the cost to the average consumer of acquiring a basket of goods and services that may be fixed or changed at specified intervals, such as yearly. |
WDI |
|
|
Poverty (POV) |
The national poverty headcount ratio is the percentage of the population living below the national poverty line. |
WDI |
|
|
Gender ratio (GEN) |
It is the percentage of the population that is female. |
WDI |
|
|
Trade openness (TRD) |
Trade is the sum of exports and imports of goods and services measured as a share of gross domestic product. |
WDI |
|
|
Internet users (INU) |
Internet users are individuals who have used the Internet (from any location) in the last 3 months. |
WDI |
|
|
GDP growth (GDPG) |
The annual percentage growth rate of GDP at market prices is based on constant local currency. |
WDI |
|
|
Income group |
1= high income ; 0=Middle income |
World Bank classification |
|
4. Empirical results and discussion
4.1. Estimation and robustness of FI index
The descriptive statistics of variables used for measuring the FI index are presented in Table 2. Before PCA, we have normalized5 the indicators of each dimension to obtain values between 0 and 1, where 1 indicates financial inclusion and 0 represents financial exclusion.
Table 2. Descriptive statistics
|
Variables |
Obs. |
Mean |
Std. dev. |
Min |
Max |
|
Branches |
458 |
4667.09 |
8163.60 |
82 |
40565 |
|
ATMs |
458 |
75.50 |
32.35 |
2.14 |
186.36 |
|
Deposits |
458 |
59.18 |
30.39 |
9.33 |
172.03 |
|
Loans |
458 |
67.53 |
38.22 |
9.45 |
188.77 |
4.1.1. PCA results
By using the PCA technique, we computed the eigenvalues of each variable. The eigenvalue of more than 1 indicates a more standardized variance among other components and it is retained for the analysis (Kasier 1960). Table 3 indicates that only two components are significant due to their high eigenvalue (more than 1). These two components have an 85.17% of variance explanation, and it is statistically significant. Table 4 indicates the component matrix. Component 1 receives its major loading from Deposit and Loan and component 2 gains its main loading from Branches and ATMs. To examine the convenience of the factors and to assign the above-extracted weights to equations, we have performed the Kaiser-Meyer-Olkin (KMO) test (more than 0.5). By doing that, we estimate the FI index for our sample as indicated in Table 5. The eigenvalues of the principal component are respectively: 2.018 (component 1); 1.267 (component 2); 0.526 (component 3) and 0.186 (component 4). So, we take only the components that have an eigenvalue of more than 1, for our PCA results of only the first and the second components are greater than 1. Consequently, the two components (2.018; 1.267) are selected for our analysis. For each selected component, the weights given by the PCA analysis are assigned. The first component of the index is calculated as follows: C1 = 0.307*Branches + 0.421*ATM + 0.585*Deposit + 0.621*Loan. Once the two components are constructed, they are aggregated by allocating a weight to each of them equal to the proportion of the explained variance in the dataset. For example, the weighting of the first composite index is 0.6143. It was computed as follows: 0.6143/ (0.6143 + 0.3856). In the same way, the weights of each intermediate composite index in the total composite index are calculated. The financial inclusion index is then computed as follows: FI = 0.6143*C1 + 0.3856*C2.
According to Table 5, the FI index results implied that the level of financial inclusion is significantly high in Cyprus, Switzerland, the UK, and Spain while the lowest value is in such countries as Georgia, Albania, Austria and Germany. The average of the selected EU countries implies that there is a considerable divergence in the financial inclusion level. The change in the financial inclusion level over time in each economy is presented in Figure 3.
Table 3. PCA results
|
Component |
Initial eigenvalues |
Extraction Sums of Squared Loadings |
||||
|
Total |
% of |
Cumulative % |
Total |
% of |
Cumulative % |
|
|
1 |
2.018 |
50.47 |
50.47 |
2.018 |
50.47 |
50.47 |
|
2 |
1.267 |
31.7 |
82.17 |
1.267 |
31.7 |
82.17 |
|
3 |
0.526 |
13.17 |
95.34 |
|||
|
4 |
0.186 |
4.66 |
100 |
|||
Source: Author’s compilation
Table 4. Component matrix of PCA and KMO test
|
Components |
KMO-test |
||
|
Variables |
1 |
2 |
0.526 (Overall) |
|
Branches |
0.304 |
0.676 |
0.502 |
|
ATM |
0.421 |
0.530 |
0.615 |
|
Deposit |
0.585 |
-0.412 |
0.506 |
|
Loan |
0.621 |
-0.301 |
0.526 |
|
Total variance explained by factors |
0.6143 |
0.3856 |
|
Source: Author’s compilation
4.1.2. Robustness of the FI index
Figure 1 and Figure 2 indicate the correlation between our indicator, and FI of Park & Mercado (2018) and Sarma (2008). The results show that the correlation of the FI index computed by applying the PCA method is significantly correlated with the index of Park & Mercado (2018) who followed another way of calculating the financial inclusion index.
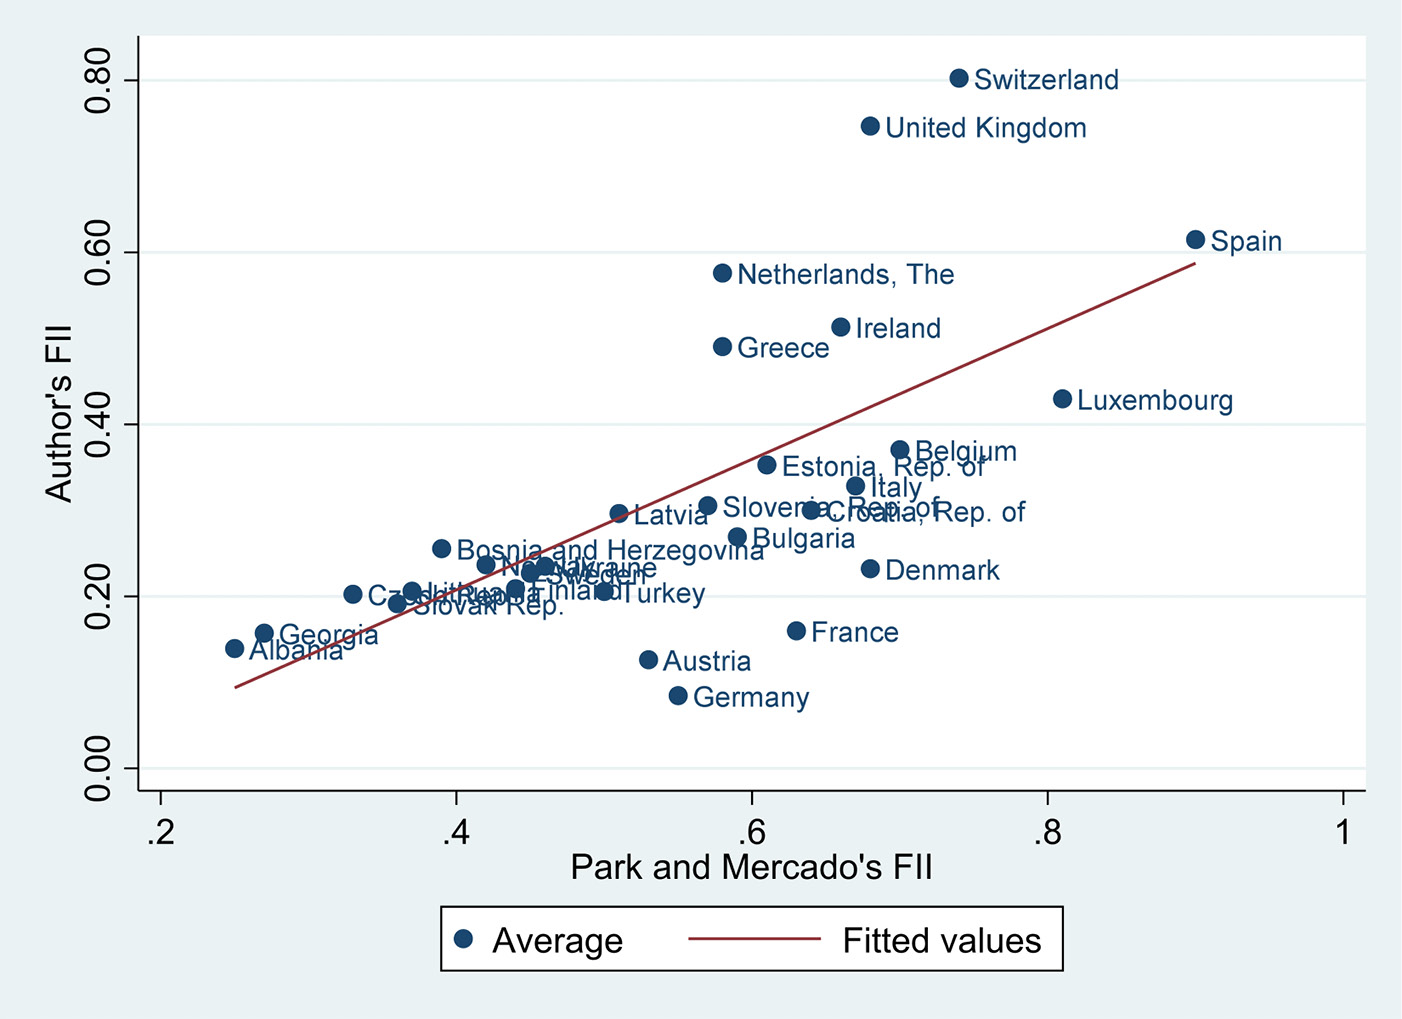
Figure 1. Author’s Financial inclusion index and Park & Mercado’s (2018) index
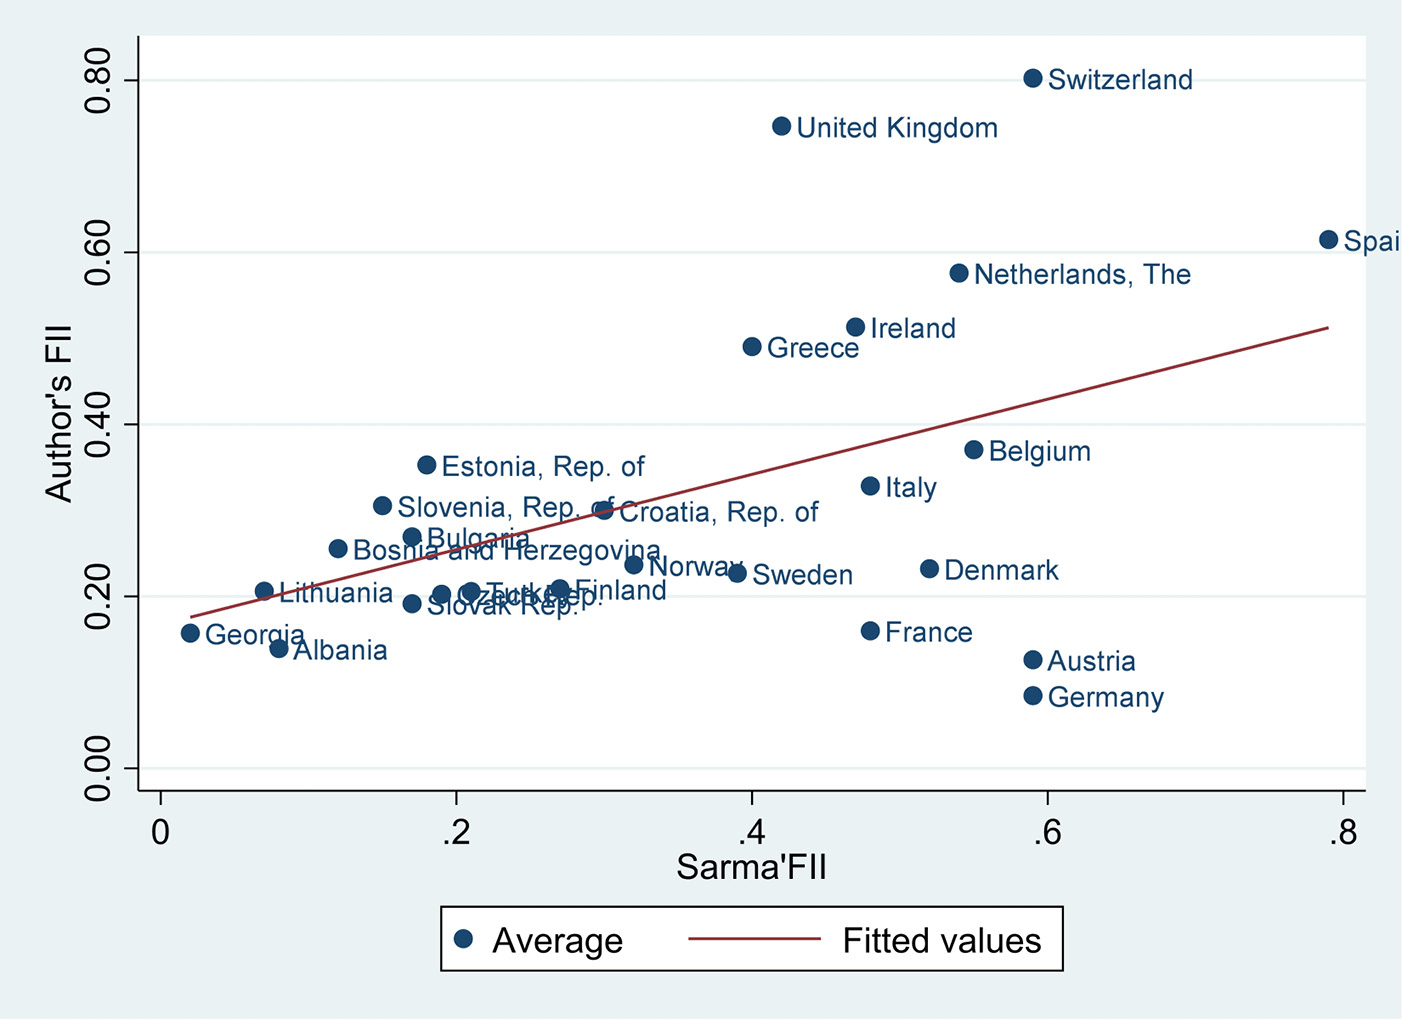
Figure 2. Author’s Financial inclusion index and Sarma’s (2008) index
Figure 3. FI index in EU countries (2004–2019)
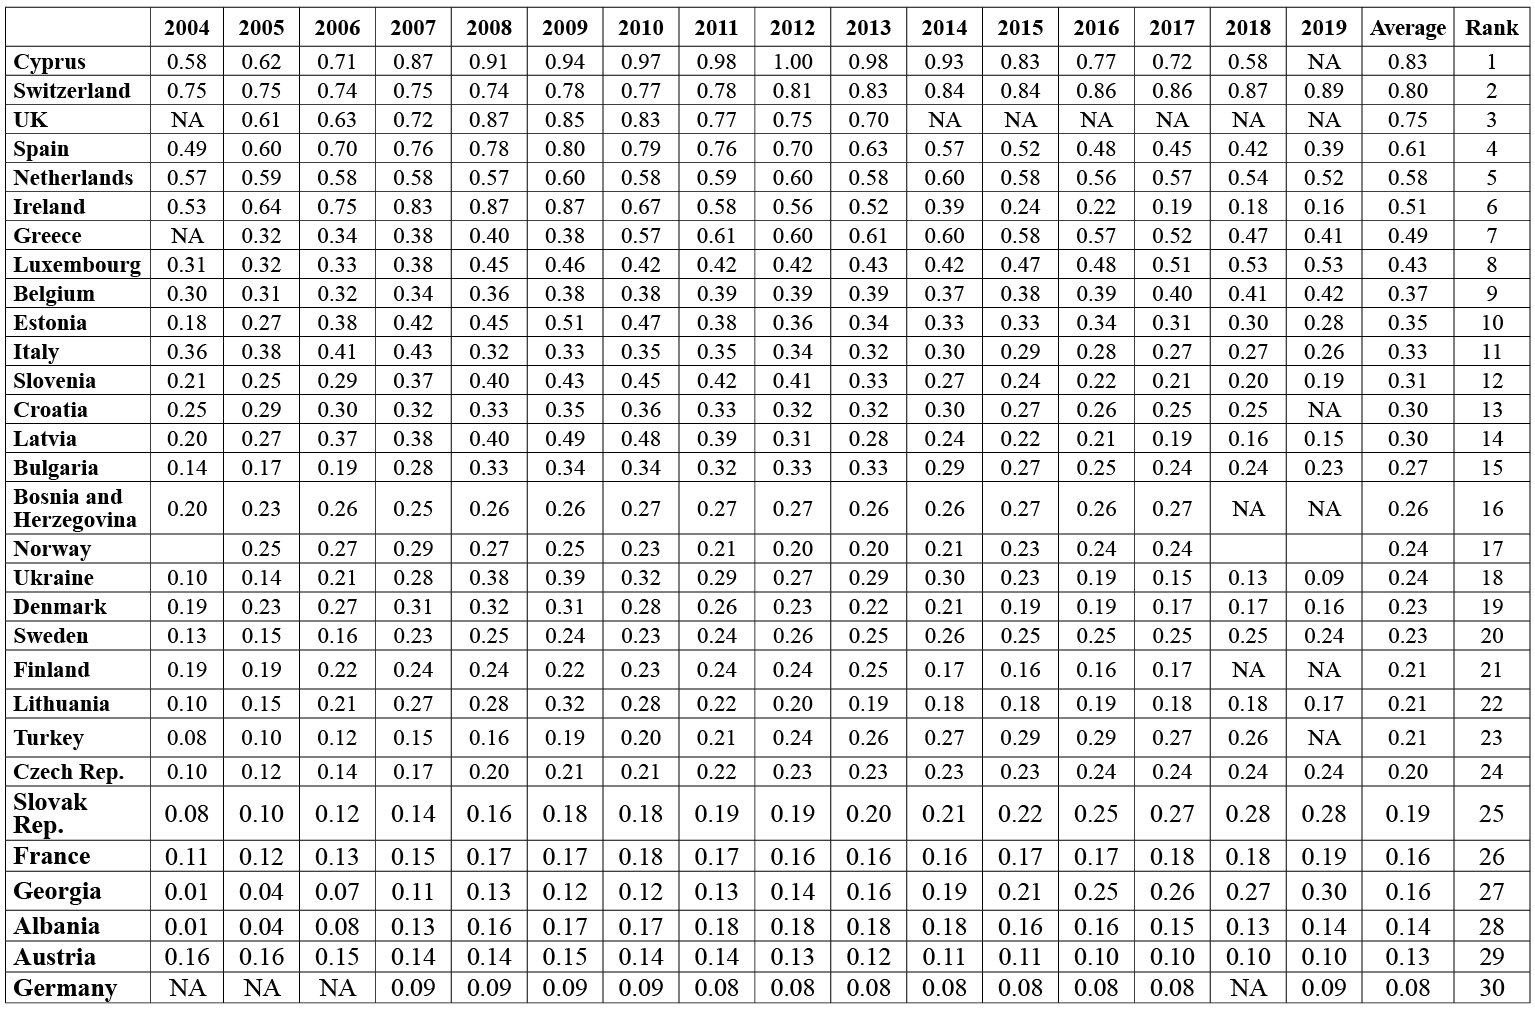
Table 5. Estimation of FI index
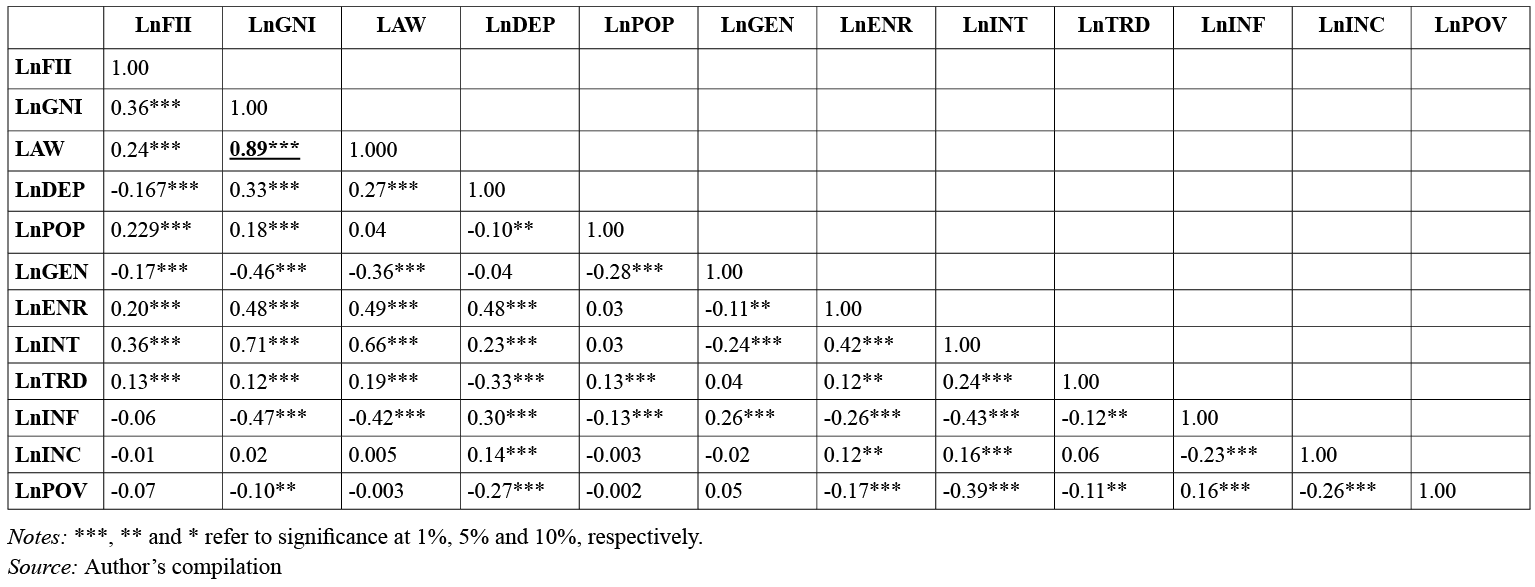
Table 6. Correlation Matrix
4.2. Determinants of financial inclusion
Following the work of C. Y. Park & Mercado (2018) who tested the significance of various factors impacting financial inclusion, we shall use the same procedure for examining the possible linkage between these factors and financial inclusion. A higher per capita income probably increases the financial inclusion level because the financial sector is more developed in higher-income economies, and, consequently, it provides better access to financial service. On the other side, the law would enhance financial inclusion as it enforces financial contracts. On the contrary, a higher age dependency ratio would decrease the level of financial inclusion for the reason that prominently younger and older people (especially after retirement) probably ‘slow down’ their earned income and consequently their access to financial services. A high-density population is considered as a larger market size for financial services, and, subsequently, it may increase the financial inclusion level. Secondary school enrolment and internet use may reach for high access to financial services because these will positively impact financial literacy. Inflation may increase access to financial services because people are afraid of depreciating the value of their savings. Gender equity may help to increase financial inclusion by giving the chance to a large number of females to have access to financial services. The differences in average living standards and the degree of income inequality in the appropriate countries are controlled by a dummy variable for high income countries.
Table 7. Determinants of financial inclusion
|
Dependent variable : Financial inclusion index |
Fixed |
Random |
GMM |
|
Independent variables |
|||
|
GNI per capita |
0.455*** |
0.383*** |
0.111** |
|
Rule of law |
0.285*** |
0.192** |
0.025 |
|
Age Dependency Ratio |
-2.098*** |
-2.095*** |
0.190 |
|
Population Density |
0.689** |
0.199 |
0.067*** |
|
Gender |
1.587 |
1.973 |
0.386 |
|
School enrolment |
-0.033 |
0.087 |
-0.167* |
|
Inflation |
0.075*** |
0.077*** |
0.012** |
|
Internet users |
0.397*** |
0.422*** |
-0.237*** |
|
Income group |
- |
-0.816*** |
-0.247*** |
|
Lag(Financial inclusion) |
- |
- |
0.813*** |
|
Constants |
-8.918 |
-7.355 |
-1.976 |
|
R-squared |
0.560 |
0.555 |
- |
|
Observations |
388 |
388 |
358 |
|
groups |
30 |
30 |
30 |
|
Prob.>F |
0.000 |
0.000 |
0.000 |
|
HAUSMAN TEST |
51.12 |
- |
- |
|
Prob. (Hausman test) |
0.000 |
- |
- |
|
AR(2)(p-Value) |
- |
- |
0.503 |
Notes: ***, ** and * refer to significance at 1%, 5% and 10%, respectively.
Source: Author’s compilation
Table 7 indicates our empirical results on the determinants that impact the financial inclusion level in European countries. Various variables are considered in our analysis after running the multicollinearity test (Table 6). Furthermore, the findings of the Hausman test depict the panel data with the fixed effect method. The fixed effect estimates indicate that the GNI per capita, rule of law, age dependency ratio, population density, inflation, and internet users significantly impact the financial inclusion level for the European countries. Particularly, GNI per capita, rule of law, population density, inflation, and internet users have a positive impact on financial inclusion; meanwhile, the age dependency ratio has a negative impact on financial inclusion. The GNI per capita is positive and strongly significant, meaning that higher financial inclusion is determined by a higher per capita income. This result is consistent with Omar & Inaba (2020), Park & Mercado (2018), and Sarma (2016). The rule of law is also positive, and it significantly influences financial inclusion, thereby suggesting that enhancing law through good governance would enforce financial contracts and consequently reduce voluntary financial exclusion. This result was also obtained by Honohan (2008) and Park & Mercado (2018), but it is not consistent with Omar & Inaba (2020). European countries with a high population density have higher access to financial services due to their larger market size. This finding is consistent with Park & Mercado (2018). Inflation has a positive and highly significant impact on the financial inclusion level, thus indicating that European countries with a high level of inflation volatility lead to a high level of financial inclusion as the value of savings increases in the financial system. This finding is in opposition with Omar & Inaba (2020). Similarly, the coefficient of internet users is positive and highly significant, thus suggesting that the internet provides easy and mobile connection to financial services. This result is similar to Omar & Inaba (2020) and Sarma & Pais (2008). On the other hand, the age dependency ratio has a negative and highly significant impact on financial inclusion, thus stating that the European countries which have a young-aged population or a rapidly aging population have a lower financial inclusion. This finding is consistent with the finding of Park & Mercado (2018) and Omar & Inaba (2020) in contradiction with the expectation that countries with a high inclusion of females and education have a higher financial inclusion. Our findings do not enhance the hypothesis that the gender and secondary school enrolment affects financial inclusion. The robustness of the above results is checked by performing GMM estimation to take into account any endogeneity of the explanatory variables (column (4) in Table 7). The coefficient of GNI per capita is 0.111 and is significant at the 5% level. The coefficient of population density is 0.067 and is significant at the 1% level. The coefficient of the rule of law and age dependency proved to be insignificant. The Arellano–Bond test’s (AR) null hypothesis assumes no autocorrelation. In this perspective, Roodman (2009) suggested diagnostic tests – first, to check the presence of first-order autocorrelation AR (1), but there is none of second-order AR (2), or we should reject null hypothesis of AR (1) but not for AR(2). So, the p-value of AR (2) is 0.503, which suggests that the model is well specified. To summarize, the GNI per capita, population density, inflation, internet users have a positive and significant impact on financial inclusion across all the regressions, and they are consistent with the findings in the literature. The rule of law has a positive impact on financial inclusion, and the age dependency ratio has a negative impact on financial inclusion. That means that the findings are quite robust against different estimation methods.
4.3. Impact of financial inclusion on poverty
In the previous section, we examined the determinants of financial inclusion. In this section, we shall test the effect of financial inclusion on poverty reduction. We include different control variables used in the work of Honohan (2008) and Park & Mercado (2018). Income distribution; Inflation which indicates the macroeconomic stability; Secondary school enrolment, which significantly influences poverty reduction; Openness of trade which improves the life-conditions of people; Also, we add the age dependency ratio, GDP growth rates, and the interaction between financial inclusion and per capita income. We tested the multicollinearity between these variables (Table 6). We should note that adding some control variables slightly reduces the number of observations. In Table 7, column 2, based on the Hausman test, we present the fixed effect results of the impact of financial inclusion on poverty. For the European countries, there is a significant negative impact of financial inclusion on poverty reduction at the 5% level. This suggests that European countries with a greater financial inclusion level have a low poverty rate. This finding is consistent with Park & Mercado (2018), Omar & Inaba (2020), Churchill & Marisetty (2020), and Nsiah et al., (2021). Income distribution measured by the GINI index shows a highly significant negative effect on poverty reduction. This suggests that the European countries with a high level of income inequality sanction poor people and favor the rich. Inflation reduces poverty in the European countries and it can be illustrated by the fact that inflation encourages rich people to invest their saving into real capital expenditures, and consequently creates more jobs that provide them with an income and thereby decreases poverty Omar & Inaba (2020). Secondary school enrolment has a significant negative impact on poverty reduction due to suggesting that education provides people with skills to integrate the labor market and consequently to earn an income and, consequently improve their life-conditions. GDP growth is significantly positive, thus suggesting that greater growth of GDP raises poverty. All other control variables have a highly significant negative impact on poverty except for the GDP growth which has a positive impact on poverty reduction. Yet, the association between GNI per capita and financial inclusion has no impact on poverty reduction, and this is not similar to the findings of Park & Mercado (2018). This does not confirm that associating financial inclusion with a higher income level probably contributes to the reduction of the poverty rate. We control the high income score by using a dummy variable for high income countries.
The robustness of the above results is checked by performing GMM estimation so that to take into account any endogeneity of the explanatory variables (column (4) in Table 8). The coefficient of financial inclusion is -0.09 and is significant at the 1% level. The coefficients of all control variables are highly significant at the 1% level, except for the secondary school enrolment. The p-value of AR (2) is 0.257 thus suggesting that the model is well specified.
Table 8. Impact of financial inclusion on poverty
|
Dependant variable : Poverty |
Fixed effect |
Random effect |
GMM |
|
Independent variables |
|||
|
Financial Inclusion Index |
-0.013** |
-0.020*** |
-0.009*** |
|
Income distribution |
-0.144*** |
-0.217*** |
-0.098*** |
|
Inflation |
-0.007*** |
-0.001 |
-0.020*** |
|
GDP growth |
0.011*** |
0.017*** |
0.016*** |
|
School enrolment |
-0.101** |
0.046** |
0.219** |
|
Openness trade |
-0.242*** |
-0.046** |
-0.098*** |
|
Age dependency ratio |
-0.242*** |
-0.248*** |
-0.598*** |
|
GNI*Financial inclusion |
-0.000*** |
-0.000*** |
-0.000 |
|
Income group |
- |
0.021*** |
0.032 |
|
Lag (Poverty) |
- |
- |
0.453*** |
|
Constants |
5.828*** |
4.440*** |
3.575*** |
|
Observations |
334 |
334 |
304 |
|
groups |
30 |
30 |
30 |
|
R-squared |
0.649 |
0.476 |
- |
|
Prob.>F |
0.000 |
0.000 |
0.000 |
|
HAUSMAN TEST |
16.62 |
- |
- |
|
Prob. (Hausman test) |
0.034 |
- |
- |
|
AR(2) p-Value |
- |
- |
0.257 |
Notes: ***, ** and * refer to significance at 1%, 5% and 10%, respectively.
Source: Author’s compilation
4.4. Impact of financial inclusion on income inequality
In this final section, we shall test the role of financial inclusion in coping with income inequality. We look forward to confirming the argument that a higher level of financial inclusion probably reduces income inequality for the reason that people with a low income can have access to financial services and thereby an increase in their income. For examining this relationship, we take into consideration such various control variables as the inflation, secondary school enrolment, gender ratio, trade openness, GDP growth, rule of law, and lastly the combination between financial inclusion and poverty rate. In Table 9, column 2, based on the Hausman test, we present the fixed effect results of the impact of financial inclusion on income inequality. This indicates that financial inclusion is powerful in alleviating income inequality in the European countries. An increase of 1% in financial inclusion index reduces income inequality by 0.56%. This estimate is highly significant, it is and consistent with Honohan (2008); Kim (2016), and Omar & Inaba (2020), but not similar to Park & Mercado (2018).Concerning the control variables, inflation is negative and significant to income inequality, thereby implying that an increase in inflation tends to reduce income inequality. The possible explanation is in the situation of inflation when debtors refuse to repay their debt when inflation is higher than their expectation. This contributes to the reduction of income inequality, particularly for those who are heavily indebted and have a lower income Park & Mercado (2015). For the secondary school enrolment, GDP growth and trade openness are not significantly associated with income inequality in the European countries. The gender ratio has a highly significant negative impact on income inequality. Last but not least, the interaction between financial inclusion and poverty is highly significant with a positive sign for European countries. This implies that the impact of this combination has a strong impact on income inequality. The explanation is that workers are paid with minimum wages and it allows to alleviate the level of poverty but not the gaps in incomes Niyimbanira (2017). We also control for high income by using a dummy variable for high income countries.
Table 9. Impact of financial inclusion on income inequality
|
Dependant variable: |
Fixed effect |
Random effect |
GMM |
|
Independent variables : |
|||
|
Financial Inclusion Index |
-0.564*** |
-0.640*** |
-0.631*** |
|
Inflation |
-0.026*** |
-0.020*** |
-0.067*** |
|
School enrolment |
0.018 |
0.028 |
-0.241** |
|
Gender |
-2.287** |
-0.019 |
0.900 |
|
Trade openness |
-0.016 |
-0.001 |
-0.137*** |
|
GDP growth |
0.005 |
0.003 |
-0.002 |
|
Financial inclusion Index*Poverty |
0.200*** |
0.226*** |
0.221*** |
|
Income group |
- |
-0.024** |
-0.050 |
|
Lag (Income distribution) |
- |
- |
-0.418*** |
|
Constants |
12.471*** |
3.439*** |
0.945 |
|
Observations |
335 |
335 |
304 |
|
groups |
30 |
30 |
30 |
|
R-squared |
0.236 |
0.219 |
- |
|
Prob.>F |
0.000 |
0.000 |
0.000 |
|
HAUSMMAN TEST |
13.28 |
||
|
Prob. (Hausman test) |
0.06 |
||
|
AR(2) p-Value |
- |
- |
0.151 |
Notes: ***, ** and * refer to significance at 1%, 5% and 10%, respectively.
Source: Author’s compilation
The robustness of the above results is checked by performing GMM estimation to take into account any endogeneity of the explanatory variables (column (4) in Table 9). The coefficient of financial inclusion is -0.631 and significant at the 1% level. The coefficients of all the control variables are highly significant at the 1% and 5% levels, except for the GDP growth and gender ratio. The p-value of AR (2) is 0.151, thereby suggesting that the model is well specified.
5. Conclusions
The contribution of this paper is the exploration of the determinants of financial inclusion and examination of the impact of financial inclusion on poverty and income inequality. For this reason, primary we constructed our financial inclusion index for 30 European countries. We included four variables in our financial inclusion index. We used the PCA method recommended by Cámara & Tuesta (2014, 2017), and we utilized annual data (2014 - 2019). The PCA method is considered a good method because it maximizes the variables of our financial inclusion index. Our financial inclusion index is quite similar to that of Park & Mercado (2018). By using this index, we examine the crucial determinants which affect financial inclusion. The results show that for the European countries, the GNI per capita, population density, inflation, and internet users have a positive and significant impact on financial inclusion across all the regressions, and they are consistent with the findings in the literature. The rule of law has a positive impact on financial inclusion, and the age dependency ratio has a negative impact on financial inclusion. For the Impact of financial inclusion on poverty reduction, this study enhances the results of previous studies on the negative relationship between education and poverty rates for the European countries. Furthermore, our findings are appropriate with the view that education decreases poverty as it provides people with skills to integrate into the labor market and consequently to earn an income. On the other side, income distribution measured by the GINI index shows a highly significant negative effect on poverty reduction. In addition, inflation reduces poverty in the European countries, and it can be illustrated by the fact that inflation encourages rich people to invest their saving into real capital expenditures, and consequently creating more jobs which provide them with an income and thereby decreases poverty. Yet, for the association between the GNI per capita and financial inclusion, no impact on poverty reduction is observed. This does not confirm the presupposition that associating financial inclusion with a higher income level probably contributes to the reduction of the poverty rate. What concerning the impact of financial inclusion on income inequality, our findings indicate that there is a highly significant correlation between the level of financial inclusion and income inequality. In addition, inflation is negative and significant to income inequality, thus implying that an increase in inflation tends to reduce income inequality. This suggests that in a situation of inflation debtors refuse to repay their debt when the inflation is higher than their expectation. This contributes to the reduction of income inequality, particularly for those who are heavily indebted and have a lower income. For the secondary school enrolment, the GDP growth and trade openness are not significantly associated with income inequality in the European countries. The gender ratio has a highly significant negative impact on income inequality. Last but not least, the interaction between the financial inclusion and poverty is highly significant with a positive sign for the European countries. This implies that the impact of this combination has a strong impact on income inequality. The explanation is that workers are paid only minimum wages and it allow to alleviate the level of poverty but not the gaps in incomes. The findings of this study suggest important policy implications for the European countries. First, financial institutions should make financial services affordable and widely available for small businesses and low-income households. For the sake of achieving that, machine learning can play an important role by using mobiles phones, social networks and messenger services. Furthermore, the use of machine learning prevents the risk of fraud and the assessment of credit and consequently the back-office costs will be lower. Second, the government, central banks, and financial institutions, should cooperate to enhance financial literacy programs especially for aged people and in rural as well as remote areas in order to raise financial awareness and change financial behaviour among low-income people. Third, the European Union’s authorities and local governments should develop the infrastructure of financial services and upgrade the financial services network in rural and urban areas especially in the European middle income countries. Fourth, economies in the European countries must continue to improve per capita income and access to information in order to minimize involuntary financial exclusion of large segments of the population. Despite some limitations such as data access, missing data and weakness of sensitivity to normalizations of the GMM regression, and by using variables of financial inclusion, we reckon that this paper makes an important contribution to the existing literature on the relationship between financial inclusion poverty and income inequality in the European countries. We recommend in the future studies to integrate more variables of the financial inclusion index and also to conduct causality tests in order to distinguish short- and long-run linkages between the dependent and independent variables. In addition, carrying out research to compare the results for new European and old European countries is recommended.
Acknowledgement
I am grateful to the editors and anonymous reviewers for helpful comments and suggestions to improve the quality of this paper.
References
Allen, F., Demirguc-Kunt, A., Klapper, L., & Martinez Peria, M. S. (2016). The foundations of financial inclusion: Understanding ownership and use of formal accounts. Journal of Financial Intermediation, 27(2016), 1–30. https://doi.org/10.1016/j.jfi.2015.12.003
Amidžić, G., Massara, A., & Mialou, A. (2014). Assessing Countries’ Financial Inclusion Standing — A New Composite Index. IMF Working Papers, WP/14/36. https://doi.org/10.7172/2353-6845.jbfe.2017.2.5
Asuming, P. O., Osei-Agyei, L. G., & Mohammed, J. I. (2019). Financial Inclusion in Sub-Saharan Africa: Recent Trends and Determinants. Journal of African Business, 20(1), 112–134. https://doi.org/10.1080/15228916.2018.1484209
Beck, T., Demirguc-Kunt, A., & Martinez Peria, M. S. (2007). Reaching out: Access to and use of banking services across countries. Journal of Financial Economics, 85(1), 234–266. https://doi.org/10.1016/j.jfineco.2006.07.002
Cámara, N., & Tuesta, D. (2014). Measuring financial inclusion: a multidimensional index. Bank for International Settlements, September. https://www.bis.org/ifc/publ/ifcb47p.pdf
Churchill, S. A., & Marisetty, V. B. (2020). Financial inclusion and poverty: a tale of forty-five thousand households. Applied Economics, 52(16), 1777–1788. https://doi.org/10.1080/00036846.2019.1678732
Datta, S. K., & Singh, K. (2019). Variation and determinants of financial inclusion and their association with human development: A cross-country analysis. IIMB Management Review, 31(4), 336–349. https://doi.org/10.1016/j.iimb.2019.07.013
Demir, A., Pesqué-Cela, V., Altunbas, Y., & Murinde, V. (2020). Fintech, financial inclusion and income inequality: a quantile regression approach. European Journal of Finance, 4364. https://doi.org/10.1080/1351847X.2020.1772335
Demirguc-Kunt, A., Klapper, L., & Singer, D. (2017). Financial Inclusion and Inclusive Growth: A Review of Recent Empirical Evidence. Financial Inclusion and Inclusive Growth: A Review of Recent Empirical Evidence, April. https://doi.org/10.1596/1813-9450-8040
Demirgüç-Kunt, A., Klapper, L., Singer, D., Ansar, S., & Hess, J. (2020). The Global Findex Database 2017: Measuring Financial Inclusion and Opportunities to Expand Access to and Use of Financial Services. World Bank Economic Review, 34(2018), S2–S8. https://doi.org/10.1093/wber/lhz013
Diliuvienė, L., & Tamašauskienė, Z. (2021). Impact of Financialization on Income Inequality in Aspect of Welfare Summary. EKonomika Vilnius University Press, 44(2), 170–187. https://doi.org/doi.org/10.15388/Soctyr.44.2.11
Evans, O., & Adeoye, B. (2016). Determinants of Financial Inclusion in Africa: A Dynamic Panel Data Approach. University of Mauritius Research Journal, 22(January 2016), 310–336. https://doi.org/10.6084/M9.FIGSHARE.3409738
Ghosh, S., & Vinod, D. (2017). What Constrains Financial Inclusion for Women? Evidence from Indian Micro data. World Development, 92, 60–81. https://doi.org/10.1016/j.worlddev.2016.11.011
Honohan, P. (2008). Cross-country variation in household access to financial services. Journal of Banking and Finance, 32(11), 2493–2500. https://doi.org/10.1016/j.jbankfin.2008.05.004
Huang, R., Kale, S., Paramati, S. R., & Taghizadeh-Hesary, F. (2021). The nexus between financial inclusion and economic development: Comparison of old and new EU member countries. Economic Analysis and Policy, 69, 1–15. https://doi.org/10.1016/j.eap.2020.10.007
Huang, Y., & Zhang, Y. (2020). Financial Inclusion and Urban–Rural Income Inequality: Long-Run and Short-Run Relationships. Emerging Markets Finance and Trade, 56(2), 457–471. https://doi.org/10.1080/1540496X.2018.1562896
Inoue, T. (2019). Financial inclusion and poverty reduction in India. Journal of Financial Economic Policy, 11(1), 21–33. https://doi.org/10.1108/JFEP-01-2018-0012
Kasier, H. F. (1960). The application of electronic computers to factor analysis. Educational and Psychological Measurement, XX(1), 141–151.
Khanh Chu, L. (2019). Determinants of Financial Inclusions: Comparing High, Middle, and Low-Income Countries. Economics Bullettin, 39(2), 1449–1457. https://doi.org/10.2139/ssrn.3349933
Kim, J. H. (2016). A study on the effect of financial inclusion on the relationship between income inequality and economic growth. Emerging Markets Finance and Trade, 52(2), 498–512. https://doi.org/10.1080/1540496X.2016.1110467
Lenka, S. K., & Bairwa, A. (2016). Does financial inclusion affect monetary policy in SAARC countries? Cogent Economics and Finance, 4(1). https://doi.org/10.1080/23322039.2015.1127011
Lockwood, B. (2004). How robust is the Kearney/foreign policy globalisation index? World Economy, 27(4), 507–523. https://doi.org/10.1111/j.0378-5920.2004.00611.x
Mialou, A., Amidzic, G., & Massara, A. (2017). Assessing Countries ’ Financial Inclusion Standing – A New Composite Index. 2(8), 105–126. https://doi.org/10.7172/2353-6845.jbfe.2017.2.5
Mohammed, J. I., Mensah, Lord, & Gyeke-Dako, A. (2017). Financial inclusion and poverty reduction in sub-Saharan Africa. African Finance Journal, 19(1), 1–22.
Mookerjee, R., & Kalipioni, P. (2010). Availability of financial services and income inequality: The evidence from many countries. Emerging Markets Review, 11(4), 404–408. https://doi.org/10.1016/j.ememar.2010.07.001
Mushtaq, R., & Bruneau, C. (2019). Microfinance, financial inclusion and ICT: Implications for poverty and inequality. Technology in Society, 59(May), 101154. https://doi.org/10.1016/j.techsoc.2019.101154
Neaime, S., & Gaysset, I. (2018). Financial inclusion and stability in MENA: Evidence from poverty and inequality. Finance Research Letters, 24(August 2017), 199–220. https://doi.org/10.1016/j.frl.2017.09.007
Nguyen, T. T. H. (2020). Measuring financial inclusion: a composite FI index for the developing countries. Journal of Economics and Development, ahead-of-p(ahead-of-print). https://doi.org/10.1108/jed-03-2020-0027
Niyimbanira, F. (2017). International Journal of Economics and Financial Issues Analysis of the Impact of Economic Growth on Income Inequality and Poverty in South Africa: The Case of Mpumalanga Province. International Journal of Economics and Financial Issues, 7(4), 254–261. http:www.econjournals.com
Nsiah, A. Y., Yusif, H., Tweneboah, G., Agyei, K., & Baidoo, S. T. (2021). The effect of financial inclusion on poverty reduction in Sub-Sahara Africa: Does threshold matter? Cogent Social Sciences, 7(1). https://doi.org/10.1080/23311886.2021.1903138
Omar, M. A., & Inaba, K. (2020). Does financial inclusion reduce poverty and income inequality in developing countries? A panel data analysis. Journal of Economic Structures, 9(1). https://doi.org/10.1186/s40008-020-00214-4
Ouechtati, I. (2020). The contribution of financial inclusion in reducing poverty and income inequality in developing countries. Asian Economic and Financial Review, 10(9), 1051–1061. https://doi.org/10.18488/JOURNAL.AEFR.2020.109.1051.1061
Park, C.-Y., & Mercado, Jr., R. (2018). Financial Inclusion: New Measurement and Cross-Country Impact Assessment. SSRN Electronic Journal, 539. https://doi.org/10.2139/ssrn.3199427
Park, C.-Y., & Mercado, R. J. (2015). Financial Inclusion, Poverty, and Income Inequality in Developing Asia. SSRN Electronic Journal, 426. https://doi.org/10.2139/ssrn.2558936
Park, C. Y., & Mercado, R. (2018). Financial Inclusion, Poverty, and Income Inequality. Singapore Economic Review, 63(1), 185–206. https://doi.org/10.1142/S0217590818410059
RATNAWATI, K. (2020). The Impact of Financial Inclusion on Economic Growth, Poverty, Income Inequality, and Financial Stability in Asia. The Journal of Asian Finance, Economics and Business, 7(10), 73–85. https://doi.org/10.13106/jafeb.2020.vol7.no10.073
Roodman, D. (2009). How to do xtabond2: An introduction to difference and system GMM in Stata. The Stata Journal, 9(1), 86–136.
Sarma, M. (2016). Financial Inclusion in Asia. In Financial Inclusion in Asia. https://doi.org/10.1057/978-1-137-58337-6
Sarma, M., & Pais, J. (2008). Financial Inclusion and Development: A Cross Country Analysis. In Annual Conference of the Human Development and Capability Association, New Delhi, 168(10–13), 1–30. https://doi.org/10.1002/jid
Soumaré, I., Tchana Tchana, F., & Kengne, T. M. (2016). Analysis of the determinants of financial inclusion in Central and West Africa. Transnational Corporations Review, 8(4), 231–249. https://doi.org/10.1080/19186444.2016.1265763
Tram, T. X. H., Lai, T. D., & Nguyen, T. T. H. (2021). Constructing a Composite Financial Inclusion Index for Developing Economies. The Quarterly Review of Economics and Finance, xxxx. https://doi.org/10.1016/j.qref.2021.01.003
Wang, X., & Guan, J. (2017). Financial inclusion: measurement, spatial effects and influencing factors. Applied Economics, 49(18), 1751–1762. https://doi.org/10.1080/00036846.2016.1226488
World Bank. (2012). Global Financial Development Report 2014: Financial Inclusion. In Washington, DC.
Yorulmaz, R. (2018). An analysis of constructing global financial inclusion indices. Borsa Istanbul Review, 18(3), 248–258. https://doi.org/10.1016/j.bir.2018.05.001
Zins, A., & Weill, L. (2016). The determinants of financial inclusion in Africa. Review of Development Finance, 6(1), 46–57. https://doi.org/10.1016/j.rdf.2016.05.001
1 https://www.ifc.org/wps/wcm/connect/0d9cffc8-a295-4e05-bf33dca8ffa5abdf/Financial+Inclusion+in+the+Digital+Age.pdf?MOD=AJPERES&CVID=m9QAISc (Accessed on 07/02/2022)
2 https://www.imf.org/en/News/Articles/2019/09/27/pr19359-imf-releases-the-2019-financial-access-survey-results (Accessed on 07/02/2022)
3 Broad money is the amount of money circulating in an economy
4 Albania, Austria, Belgium, Bosnia and Herzegovina, Bulgaria, Croatia, Cyprus, the Czech Republic, Denmark, Estonia, Finland, France, Georgia, Germany, Greece, Ireland, Italy, Lithuania, Luxembourg, Netherlands, Norway, the Slovak Republic, Slovenia, Spain, Sweden, Switzerland, Turkey, the United Kingdom.
5 The normalized value of ei for variable E in ith row is calculated as:

where
Emin = the minimum value for variable E
Emax = the maximum value for variable E