Ekonomika ISSN 1392-1258 eISSN 2424-6166
2022, vol. 101(1), pp. 62–83 DOI: https://doi.org/10.15388/Ekon.2022.101.1.4
The Impact of Income Inequality, Renewable Energy Consumption, Non-Renewable Energy Consumption and Per Capita Income on Poverty: Evidence from BRICS Economies
Doğan Barak
Bingol University, Faculty of Economics and Administrative Sciences, Turkey
Email: dbarak@bingol.edu.tr
ORCID: htttps://orcid.org/0000-0002-8812-7668
Abstract. The main purpose of this study is to investigate the role of income inequality, per capita renewable and per capita non-renewable energy consumption, per capita income on poverty reduction in BRICS (Brazil, Russia, India, China, South Africa) countries over the period between 1991–2019. This study used second-generation panel data methodologies taking into account cross-dependence between countries, which gives more accurate results. The outcomes of the panel ARDL unveiled that while an increase in income inequality and per capita non-renewable energy consumption increases poverty, an increase in growth and per capita renewable energy consumption decreases poverty. Based on the findings, policymakers should focus their efforts on developing an appropriate energy strategy that highlights the necessity of a renewable energy-driven economy powered by energy-saving technologies.
Keywords: poverty, energy consumption, income inequality, panel ARDL.
_________
Received: 04/11/2021. Revised: 23/01/2022. Accepted: 04/03/2022
Copyright © 2022 Doğan Barak. Published by Vilnius University Press
This is an Open Access article distributed under the terms of the Creative Commons Attribution License, which permits unrestricted use, distribution, and reproduction in any medium, provided the original author and source are credited.
Introduction
Poverty not only encompasses lack of income and productive resources. Poverty encompasses lack of income and productive resources, as well as hunger and malnutrition, limited access to education and other basic services, social discrimination and exclusion, and lack of participation in decision-making processes (UN, 2021b). The eradication of poverty, which is a global problem, is among the main goals of international institutions. Poverty alleviation, the reduction of income inequality and the availability of modern energy are three of the most important agendas in the sustainable development goals (SDGs). The first aim of the SDG is to end poverty in all its forms everywhere. The 2030 Agenda recognizes that ending poverty in all of its forms and dimensions is the most pressing global challenge and a prerequisite for long-term development. The World Bank (2021) stated that global poverty rose in 2020 for the first time in over 20 years. Also, it was stated that approximately 100 million additional people are living in poverty due to the pandemic, and this figure will gradually increase. 736 million people still live in extreme poverty – hence, 10 percent of the world’s population lives in extreme poverty. Some 1.3 billion people live in multidimensional poverty. Half of all people living in poverty are under 18. One person in every 10 is extremely poor (UN, 2021a). Moreover, poverty and inequality are exacerbated by climate disruptions, global health pandemics (like COVD-19) and macroeconomic shocks (Adeleye et al., 2020).
The impact of inequality on poverty reduction is larger than growth. However, most of the observed changes in poverty can be explained by changes in mean incomes (Bergstrom, 2020). Income inequality rose steadily in advanced economies and in some large emerging market economies. In advanced economies, poverty rates are low and GDP per capita growth has been slowing down every decade since the 1980s. In the developing countries, poverty rates have been declining. GDP per capita growth has accelerated in emerging markets and low-income countries, particularly since the 2000s (Cerra, Lama and Loayza, 2021). Despite the economic growth recorded in the developing countries, poverty and especially inequality are also observed (Adeleye et al., 2020).
Another important factor in reducing poverty is energy. Energy is an important input for both human and industrial development. This means that it is a crucial requirement for the sustainability and economic well-being of an economy (Rafindadi and Ozturk, 2017). Energy is one of the most basic inputs for people’s livelihood and economy. Lack of access to adequate, affordable and clean energy sources harms people’s living conditions, health and their ability to engage in productive activities. This can cause people to remain in poverty (Hussein, Leal Filho, 2012; Khobai, 2021). Energy can be used as one of the instruments to poverty alleviation, especially in the developing countries. None of the basic needs of people can be provided without energy (Hussein, Leal Filho, 2012). Renewable energy can help alleviate poverty by offering good jobs for the poor, in addition to enhancing energy security, boosting energy access, and mitigating climate change (Jairaj et al., 2017). Energy has been recognized as an important promoter of development (Diaz-Chavez et al., 2015). The relationship between energy and poverty reduction is manifold. The benefits that access to energy can create in poor regions are not to be ignored (Diaz-Chavez et al., 2015).
It is a well-known fact that renewable energy consumption has a positive effect on GDP (Inglesi-Lotz, 2016; Ito, 2017; Narayan and Doytch, 2017; Koçak and Şarkgüneşi, 2017). New employment opportunities will emerge when renewable energy investments are encouraged. Therefore, the more people are employed, the easier it will be to meet basic needs through poverty reduction (Zeb et al., 2014). In rural locations where opportunities are scarce, the lack of access to modern energy sources exacerbates poverty. Expanding access to electricity should be a part of the public policy aimed at eradicating poverty (Pereira, Freitas and da Silva 2010).
The rapid economic growth experienced in the BRICS countries has played an active role in reducing poverty. On the other hand, they have made significant progress in reducing poverty through policies such as employment and social protection measures. However, income inequality has emerged as a major challenge for the BRICS countries (ILO, 2020). Energy is a critical component of achieving sustainable development, which includes poverty reduction, social development, and environmental development (Hussein, Leal Filho, 2012; Kaygusuz, 2011). Therefore, in this study, the effect of income inequality, per capita renewable energy consumption, per capita non-renewable energy consumption and per capita income on poverty reduction are examined. While Sakanko and David (2018), Okwanya and Abah (2018) and Tsaurai (2021) examined the effect of the total energy consumption on poverty, Thiam (2011) and Khobai (2021) examined the effect of renewable energy consumption on poverty. However, neither the impact of renewable nor that of non-renewable energy consumption on poverty has ever been examined. Here, besides income inequality and per capita income, the effect of per capita renewable and non-renewable energy consumption on poverty is examined.
The BRICS countries have experienced significant economic growth over the past two decades. BRICS countries make up 40% of the world’s population, contribute approximately 21% to the world’s gross domestic product (GDP), and consume 40% of the world’s energy (Danish and Wang, 2019: 1076; Ulucak, et al., 2020: 813). Despite all this, the BRICS countries are not in a position to reach SDG 1 (no poverty) in absolute terms (Vyas-Doorgapersad, 2021: 7). This study seeks to address the following key research questions: What impacts do income inequality, renewable energy consumption, non-renewable energy consumption and per capita income have on poverty in the context of the BRICS countries? The contribution of this study is as follows. First, this study does not concentrate only on the effect of income inequality and per capita income on poverty, but also on the impact of renewable energy consumption and non-renewable energy consumption on poverty as well. Second, we have incorporated income inequality and per capita income as an important control variable in the poverty model.
Considering the relationship between poverty and income inequality, renewable energy consumption, non-renewable energy consumption and per capita income, the following proposed hypotheses shall be tested in the empirical investigation:
H1: Income inequality has a negative influence over poverty reduction.
H2: Renewable energy consumption has a positive influence over poverty reduction.
H3: Non-renewable energy consumption has a negative influence over poverty reduction.
H4: Income has a positive influence over poverty reduction.
The rest of the paper is as follows: Section 2 reviews the relevant literature. Section 3 describes the data set and the empirical model. Section 4 reveals the result output. Section 5 provides conclusions.
1. Theoretical Framework
On the relationship between growth and poverty, there are two points of view. The trickle-down hypothesis is one of these two viewpoints, while the trickle-up theory is the other. According to the trickle-down theory, economic expansion is beneficial to poverty alleviation. According to this hypothesis, the benefits of a country’s growth trickle down to the poor. As a result, increasing economic growth should be the goal if poverty is to be minimized. According to the trickle-up theory, economic expansion is bad for poverty alleviation. According to this hypothesis, the gains of a country’s economic progress trickle down to the middle and upper classes (Todaro, 1997; Norton, 2002; Nyasha, Gwenhure and Odhiambo, 2017; Khobai, 2021). It has also been stated that the relationship between economic growth and poverty can be multidirectional (Hichem, 2016; Khobai, 2021); i) economic growth is considered as an important and necessary condition in reducing poverty due to the effects of inequality. ii) a high growth rate should be achieved if poverty is to be reduced in the long run. iii) poverty reduction can be achieved when growth sources are expanded. iv) the effects of growth on poverty differ between countries due to many factors.
The relationship between energy consumption and poverty has been investigated in the literature (Foster, Tre and Wodon, 2000; Foster and Tré, 2003; Barnes, Khandker and Samad, 2010; Khandker, Barnes and Samad, 2012). The relationship between energy consumption and poverty has been explained by the energy transition theory (Hosier and Dowd, 1987; Leach, 1992). According to this theory, energy use and per capita income are inextricably linked. According to this notion, when a person’s income level rises, they are more likely to transition from traditional to modern energy. High-income countries use more contemporary and modern energy than low-income countries. As a result, having access to modern energy raises income levels and helps to alleviate poverty (Okwanya and Abah, 2018; Kousar and Shabbir, 2021).
2. Literature
2.1. Income inequality, growth and poverty
The nexus between income inequality, growth and poverty has been investigated in many studies (Alesina and Rodrik,1994; Deininger and Squire, 1996; Barro, 2000; Forbes, 2000; Dollar and Kraay, 2002; Sasmal and Sasmal, 2016; Anikin and Tikhonova, 2016; Dollar, Kleineberg and Kraay, 2016; Nyasha, Gwenhure and Odhiambo, 2017; Marrero and Servén, 2018; Nansadiqa, Masbar and Majid, 2019; Feriyanto, El Aiyubbi and Nurdany, 2020; Dada and Fanowopo, 2020; Zaman et al., 2020; Hailemariam and Dzhumashev, 2020). Growth and income inequality, according to Cheema and Sial (2012), play a significant impact in affecting poverty in Pakistan. To alleviate poverty, the government should enact measures that promote economic growth while also improving income distribution. According to Nyasha, Gwenhure and Odhiambo (2017), growth strategies should be prioritized because, in the long run, economic growth contributes to poverty reduction in Ethiopia. This would ensure that poverty is reduced as much as possible. Michálek and Výbošťok (2019) examine relationship between growth, income inequality and poverty in Europa for the period of 2005–2015. The result revealed that growth and income inequality have a negative and positive effect on poverty, respectively. Zaman et al. (2011) examine the impact of economic growth and income inequality on poverty in India, Nepal, Pakistan and Sri Lanka. The study revealed that economic growth and income inequality reduce poverty.
There are also studies showing that there is a positive relationship between economic growth and poverty. Aigbokhan (2000) examined the relationship between poverty, inequality and economic growth in Nigeria for the period of 1986–1996. The study revealed that there is a positive relationship between growth and poverty. Stephen and Simeon (2013) revealed that there is a positive relationship between economic growth and poverty in Nigeria. Tridico (2010) showed that growth did not reduce poverty, and income inequality worsened in 50 emerging and transition economies for the period of 1995–2006. Nuruddeen and Ibrahim (2014) showed that an increase in GDP in Nigeria caused a high level of poverty.
Table 1 summarizes the literature focusing on the relationship between income inequality, economic growth, and poverty. The results in the literature generally revealed that there is a negative relationship between growth and poverty, and a positive relationship between income inequality and poverty. This evidence emphasizes the importance of economic growth and income inequality for poverty.
Table 1. Literature on the relationship between economic growth, income inequality and poverty
|
Author |
Country/ Period |
Method |
Conclusion |
|
Mulok et al. (2012) |
Malaysia/1970–2009 |
ARDL |
economic growth reduces poverty |
|
Stephen and Simeon (2013) |
Nigeria/1980–2008 |
OLS |
economic growth reduces poverty |
|
Nuruddeen and Ibrahim (2014) |
Nigeria/2000–2012 |
ARDL, Granger causality test |
increase in growth causes high level of poverty |
|
Hassan, Zaman and Gul (2015) |
Pakistan/1980–2011 |
ECM |
inequality increases poverty |
|
Soylu (2015) |
Canada/1976–2015 |
ARDL |
growth and income inequality affect poverty negatively and positively, respectively |
|
Nyasha, Gwenhure and Odhiambo (2017) |
Ethiopia/1970–2014 |
ARDL |
economic growth reduces poverty |
|
Garza-Rodriguez (2018) |
Mexico/1960–2016 |
Gregory-Hansen cointegration, VECM |
economic growth reduces poverty |
|
Sehrawat and Giri (2018) |
India/1970–2015 |
ARDL |
while economic growth decreases poverty, inequality increases poverty |
|
Leow and Tan (2019) |
145 countries/1982–2017 |
GMM |
economic growth and inequality decrease and increase poverty, respectively |
|
Dada and Fanowopo (2020) |
Nigeria/1984–2018 |
ARDL |
economic growth reduces poverty |
|
Zaman et al., (2020) |
124 countries/2010–2013 |
PMG |
income inequality and mean income increases and decreases poverty, respectively |
|
Feriyanto, El Aiyubbi and Nurdany (2020) |
Indonesia/2010–2019 |
FE |
GRDP reduces poverty |
|
Omar and Inaba (2020) |
116 developing countries/2004–2016 |
FE |
income inequality increases poverty |
|
Alam (2020) |
23 countries/1990–2014 |
PCSE, dynamic panel GMM |
negative linear relationship between growth and poverty, non-linear relationship between growth, poverty and inequality |
|
Anser et al., (2020) |
16 diversified countries/1990–2014/ |
GMM |
growth reduces poverty |
|
Chishti, Rehman and Murshed (2021) |
Pakistan/1972–2018 |
NARDL |
per capita income reduce the poverty |
|
Imimole (2021) |
Nigeria/1980–2019 |
Granger Causality test, ARDL |
inequality and growth impact poverty positively and negatively, respectively |
|
Solarin (2021) |
30 developing countries/2010–2019/ |
GMM |
real GDP per capita reduces income poverty and health poverty |
2.2. Energy consumption and poverty
The link between energy and poverty is a result of the link between energy and economic growth. The energy utilized in manufacturing has a significant impact on poverty reduction. When energy is used by the poor to earn or enhance their income, it has a direct influence on poverty (Cabraal, Barnes and Agarwal, 2005). Okwanya, Moses and Alhassan (2015) emphasized that it is important to make energy available in order to increase employment and income level and reduce poverty in Nigeria. Okwanya and Abah (2018) emphasized that, in order to maximize the impact of energy consumption on poverty reduction, governments in 12 African countries need to improve the energy-related infrastructure and maintain political stability. Chirambo (2018) revealed that electrification can stimulate economic growth, reduce youth unemployment, reduce inequality and alleviate poverty in Sub-Saharan Africa. Mboumboue and Njomo (2016) stressed that by enhancing the standard of living and the quality of life, energy plays a critical role in social and economic growth. Energy is important for environment, macroeconomic growth, overcoming poverty, expanding employment opportunities, gender equality, education and health, promoting human development (UNDP, 2005). Availability and affordability of modern energy resources should be increased in order to reduce poverty and increase income level (Sakanko and David, 2018).
Also, there are some studies in the literature focusing on the relationship between the adoption of alternative renewable energy sources and poverty reduction. Geall and Shen (2018) analyzed the role of solar photovoltaic (PV) technologies in poverty reduction in China. They revealed that solar energy systems were not effective in improving living standards for most nomadic households. A more flexible PV-based intervention approach, according to Liao and Fei (2019), can have a stronger impact on poverty reduction in China’s remote rural areas. Zhang et al. (2020) found that photovoltaic investment is positive and significant in reducing poverty in China. Li et al. (2020) verified the impact of solar PV poverty alleviation in China. Liu et al. (2021) analyzed the role of solar PV to livelihood improvements in rural China. They revealed that the impact of solar PV plants on poverty alleviation varies by region.
The literature on the association between energy consumption and poverty is summarized in Table 2. As seen in the table, in general, energy consumption reduces poverty. On the other hand, while modern energy reduces poverty, non-modern energy increases poverty.
Table 2. Literature on the relationship between energy consumption and poverty
|
Author |
Period /Country |
Method |
Conclusion |
|
Thiam (2011) |
Senegal/1990–2005 |
life-cycle-cost approach |
energy consumption reduces poverty |
|
Ngepah (2011) |
South Africa/1993–2008 |
OLS |
while gasoline, kerosene and coal increase poverty, gas and diesel have significant poverty reducing effects |
|
Okwanya, Moses and Alhassan (2015) |
Nigeria/1990–2011 |
OLS, Granger Causality test |
energy consumption reduces poverty |
|
Okwanya and Abah (2018) |
12 African countries/1981–2014 |
FMOLS |
energy consumption reduces poverty |
|
Sakanko and David (2018) |
Nigeria/2006 |
descriptive statistics and logit regression model |
energy consumption reduces poverty |
|
Aghaei and Rezaghoizadeh (2018) |
Iran/1984–2010 |
2SLS and 3SLS |
natural gas and electricity are more effective to reduction of poverty |
|
Nwani and Osuji (2020) |
20 Sub-Saharan African countries/1990–2018 |
PLS and RLS |
the impact of energy consumption on HDI is positive |
|
Aghaei and Lin Lawell (2020) |
Iran/1989–2018 |
2SLS and 3SLS |
energy consumption decreases poverty |
|
Khobai (2021) |
South Africa/1990–2018 |
ARDL and VECM |
REC reduces poverty |
|
Ogbeide-Osaretin (2021) |
Nigeria/1990–2017 |
ARDL |
Non-modern sources of energy consumption increase poverty while electricity reduces poverty |
|
Tsaurai (2021) |
BRICS/1995–2018 |
FE, pooled OLS, RE, FMOLS |
energy consumption reduces poverty |
|
Kousar and Shabbir (2021) |
Pakistan/1985–2017 |
ARDL |
energy consumption reduces poverty |
Abbreviations For Table 1 and Table 2; ARDL, Autoregressive Distributed Lag; NARDL, nonlinear ARDL; OLS, Ordinary Least Squares; ECM, Error Correction Model; VECM, Vector Error Correction Model; GMM, Generalized Method of Moments; PMG, Pooled Mean Group; FE, Fixed Effect; RE, Random Effect; FMOLS, Fully Modified Least Squares; 2SLS, Two-Stage Least Squares; 3SLS, Three-Stage Least Squares; PCSE, Panel Corrected Standard Error; PLS, Panel Least Square; RLS, Robust Least Square; GRDP, Real Gross Regional Domestic Product.
3. Empirical model and data
3.1. Data
The study uses panel data of BRICS (Brazil, Russia, India, China and South Africa) countries from 1991–2019. The study’s variables are poverty, income inequality, per capita renewable energy consumption, per capita non-renewable energy consumption and per capita income. All variables are in the logarithmic form. The panel version of the empirical model is constructed as follows:
ln POVit = δ0 + δ1 ln INEQit + δ2 lnRECit + δ3 lnNRECit + δ4 lnGDPit + εit (1)
where i, t and εit refer to cross-sections (countries), the time period (years), and the residual term, respectively. ln POVit is the natural log of the poverty reduction, ln INEQit is the natural log of income inequality, ln RECit is the natural log of per capita renewable energy consumption, ln NRECit is the natural log of per capita non-renewable energy consumption and ln GDPit is the natural log of per capita income.
The variables used in the study are measured as follows: different variables are used as measures of poverty in empirical studies. Headcount-based data for the poor (Omar and Inaba, 2020; Baloch et al., 2020; Kousar and Shabbir, 2021; Solarin, 2021; Ogbeide-Osaretin, 2021), income (Adekoya, 2018), infant mortality (Tsaurai, 2018; Magombeyi and Odhiambo, 2018; Khobai, 2021; Solarin, 2021), life expectancy (Magombeyi and Odhiambo, 2018; Tsaurai, 2018), multidimensional poverty index (Aziz et al., 2020; Osinubi and Olomola, 2020) and human development index (Nwani and Osuji, 2020) are used as proxy for poverty in some studies. Some other studies used per capita consumption expenditure as proxy for poverty due to the lack of data on poverty (Quartey, 2008; Odhiambo, 2009; Odhiambo, 2011; Nayasha, Gwenhure and Odhiambo, 2017; Sehrawat and Giri, 2018; Adeleye et al., 2020; Dada and Fanowopo, 2020; Garidzirai and Matiza, 2020). The consumption expenditures of the poor are generally more reliably reported and more stable than income (Ravallion, 1992; Datt and Ravallion, 1992; Quartey, 2008; Sehrawat and Giri, 2016; Sehrawat and Giri, 2018). Therefore, in this study, per capita consumption expenditures are used as a proxy variable for the poverty reduction variable, as in the studies of Nayasha, Gwenhure and Odhiambo (2017), Sehrawat and Giri (2018), Dada and Fanowopo (2020) and Garidzirai and Matiza (2020). Per capita consumption expenditure is measured in USD (current). The income share of the top 10% (P10) is used as a proxy of income inequality. The income share of the top ten percent (P10) refers to the top ten percent of earners, representing capital concentration. Furthermore, this measure is capable of sensitively capturing changes in wealth disparity. As more wealth is concentrated in the hands of a smaller number of people, it becomes a significant indicator of rising inequality (Wu and Xie, 2020). In this study, the income share of the top 10% (P10) is used as a proxy variable for the income inequality variable, as in Wu and Xie (2020) and Saha and Mishra (2020). Wind, hydro, and nuclear energy sources are used as a proxy for renewable energy consumption, coal, oil, and gas are used as a proxy for non-renewable energy consumption as in Mahmood, Wang and Hassan (2019). Per capita income is measured in USD (current) and used as a proxy for economic growth. Per capita consumption expenditures (as proxy for poverty reduction.) and per capita income are gathered from the World Bank (2021) database. Both per capita renewable and per capita non-renewable energy consumption data are collected from the BP Statistical Review (2021). Income inequality is extracted from the World Inequality Database (2021).
3.2. Methodology
Before the econometric model estimation, some preliminary tests are performed. These tests are cross-sectional dependence (CSD), slope homogeneity analysis, and unit root analysis. Panel data techniques that overlook the CSD are claimed to produce stationarity and cointegration features that are biased and inconsistent (Destek, Ulucak and Dogan, 2018; Murshed, Haseeb and Alam, 2021). Since the first generation unit root and cointegration tests ignore the CSD, the applications of these methods are no longer valid in the presence of CSD (Li et al., 2021). Ignoring CSD in the model predictions may lead to an estimator efficiency loss and invalid test statistics (Lau et al., 2019). Due to trade internationalization, financial integration and globalization, any shock experienced in one country is also experienced in other countries (Qamruzzaman and Jianguo, 2020: 831). Since BRICS countries have similar economic characteristics, the investigation of the presence of cross-section dependency testing is important. Therefore, the presence of CSD among BRICS countries is tested first.
One of the tests developed to examine the CSD is the Lagrange Multiplier (LM) test (Breusch and Pagan, 1980), and this test is conducted by using the following equation:
yit = αi + βi xit + εit i = 1 ..., N ve t = 1 ..., T (2)
In the Equation above, i and t denote the cross-section dimension and time period, respectively. While the null hypothesis of this test is expressed as there is no CSD between the units  , the alternative hypothesis is expressed as there is a CSD between the units
  . The LM test is computed with the following formula:
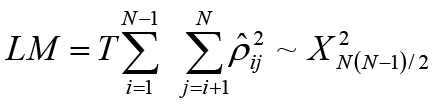 (3)
(3)
where  is the simple correlation coefficient between the residuals obtained from the ordinary least squares (OLS) and estimation of each equation. The LM test is an appropriate test when N is small and T is large enough. Pesaran (2004) states that this test cannot be applied when N is large. For large panels with T → ∞ and N → ∞, Pesaran (2004) proposed a scaled version of the LM test. The CDLM version developed by Pesaran (2004) is as follows:
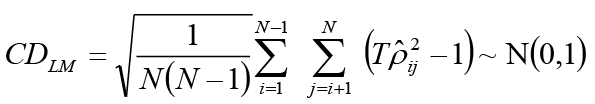 (4)
(4)
Pesaran (2004) developed a more comprehensible test because the CDLM test tends to dimension failures when N is large and T is small. The computation of the CD test developed by Pesaran (2004) is as follows:
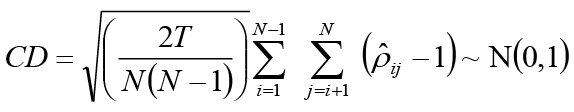 (5)
(5)
In other cases, however, if the population average pair-wise correlations are zero, the CD test will be ineffective. As a result, Pesaran et al. (2008) propose a bias-adjusted test, a modified version of the LM test. The bias-adjusted LM test (LMadj) is:
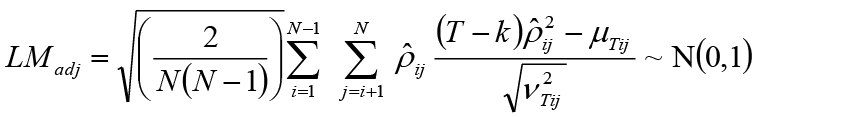 (6)
(6)
where  respectively are the number of regressors, the exact mean, and the variance of
  .
.
In addition, the test developed by Pesaran and Yamagata (2008) was applied to check the slope homogeneity issue.
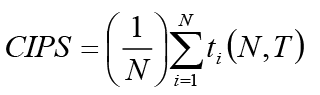
The computation of the cross-sectional ADF (CADF) regression, as developed by Pesaran (2007), which takes into account cross-sectional dependence, is as follows:
 (7)
(7)
Where αi is the deterministic term, k is the lag length, and  is the cross-sectional mean of time t. Following the above equation, t-statistics are obtained by calculating individual ADF statistics. Also, CIPS is taken from the average CADF statistic for each i as follows:
 (8)
(8)
Pesaran (2007) provides the critical values for the CIPS test.
The DH approach permits to obtain heterogeneous slope coefficients and considers the cross-section dependence (Erdogan, Okumus and Guzel, 2020: 23659). Westerlund (2008) Durbin-Hausman (D-H) cointegration method was used to examine the validity of the long-term relationship between income inequality, per capita renewable energy consumption, per capita non-renewable energy consumption, per capita income and poverty reduction. The D-H approach is used to deal with CSD and heterogeneity (Amin, Jamasb and Nepal, 2021: 426). Also, the D-H approach could be applied in case of the regressor(s) being stationary. The D-H panel cointegration test does not require any prior knowledge of the variables’ integration order (Erdogan, Okumus and Guzel, 2020; Amin, Jamasb and Nepal, 2021).
D-H test is divided into two categories as D-H Panel (DHp) test and D-H Group (DHg) test. Both can be defined as follows:
 (9)
(9)
While the DH-group statistic assumes that the autoregressive parameters are heterogeneous, the DH-panel statistic assumes that the autoregressive parameters are homogeneous. DHp tests H0 = φi = φ = 1 for all cross-sections against H1 = φi = φ < 1 for all cross-sections in the panel dataset. On the other hand, DHg tests H0 = φi = 1 for all cross-sections against H0 = φi < 1 for at least one cross-section within the panel dataset (Westerlund, 2008).
In the study, the long-run and short-run relationships between income inequality, per capita renewable energy consumption, per capita non-renewable energy consumption, per capita GDP and poverty reduction are examined via the panel autoregressive distributed lag (ARDL). The importance of the temporal dimension of the panel under consideration offers the possibility of a long-term relationship between the variables and the resulting causal links (Attiaoui and Boufateh, 2019: 13337). For this, the ARDL method was applied. The study uses two estimators which are suggested by the panel ARDL method. The first technique, namely Mean Group (MG), was developed by Pesaran and Smith (1995). The second technique, namely Pooled Mean Group (PMG), was developed by Pesaran et al. (1999). The panel ARDL approach is an econometric technique that offers a number of benefits. The following are some of the benefits: i) The panel ARDL framework generates both short-run and long-run estimates at the same time. ii) The panel ARDL approach is appropriate when variables have different integration levels, such as I(0), I(1), or mixed. iii) The panel ARDL technique is a panel cointegration technique for estimating dynamic panels with variable estimated parameters across countries. iv) The panel ARDL model uses the error correction model (Tarazkar et al., 2020; Sulaiman and Abdul-Rahim, 2020; Shafique et al., 2021). A comparison and choice between PMG and MG estimators is required in terms of efficiency and consistency. For this, the Hausman test is applied.
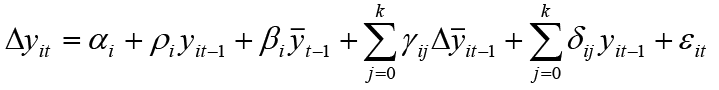
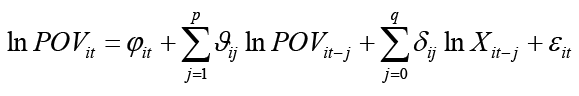
The relationship between income inequality, per capita renewable energy consumption, per capita non-renewable energy consumption, per capita GDP, and poverty reduction in BRICS countries following the panel ARDL(p,q) model equation is shown by Equation (10):
 (10)
(10)
where i = 1, 2,…, N represents the cross-sectional unit, t represents the time, j represents the number of time lags, p represents the lag of the dependent variable, and q represents the lag of independent variables. Also, Xit represents the vector of independent variables (income inequality, per capita renewable energy consumption, per capita non-renewable energy consumption, per capita GDP).
4. Results and Discussions
Before applying the panel data technique, we first examined the presence of panel variables of CSD by using the CSD tests (Breusch and Pagan (1980) LM test, Pesaran (2004) CDLM test, Pesaran (2004) CD test and Pesaran, Ullah and Yamagata (2008) LMadj test). According to the results given in Table 3, the null hypothesis of CSD is rejected. Hence, each of our series confirm the presence of CSD. For this reason, the second generation panel data method, which takes CSD into account, was applied in the study. According to the results of the Pesaran and Yamagata (2008) test which helps to examine the heterogeneity of the slope coefficients, the presence of slope heterogeneity in the data was determined. Table 3 reveals the slope heterogeneity test result.
Table 3. Results for CSD and slope homogeneity tests
|
Tests |
lnPOV |
lnGINI |
lnREC |
lnNREC |
lnGDP |
|
CSD (constant) |
|||||
|
LM (Breusch, Pagan 1980) |
31.737a |
31.272a |
29.057a |
22.509b |
26.354a |
|
CDLM (Pesaran, 2004) |
4.860a |
4.757a |
4.261a |
2.797a |
3.657a |
|
CD (Pesaran, 2004) |
-2.693a |
-3.477a |
-3.544a |
-3.459a |
-2.416a |
|
LMadj (PUY, 2008) |
9.578a |
4.203a |
3.790a |
9.764a |
6.397a |
|
CSD (constant and trend) |
|||||
|
LM (Breusch,Pagan 1980) |
30.896a |
28.827a |
35.534a |
20.781b |
21.840a |
|
CDLM (Pesaran 2004) |
4.672a |
4.210a |
5.710a |
2.411a |
2.647a |
|
CD (Pesaran 2004) |
-2.685a |
-3.245a |
-3.270a |
-3.298a |
-2.496a |
|
LMadj (PUY, 2008) |
8.969a |
3.579a |
3.530a |
9.414a |
5.910a |
|
Homogeneity tests |
|||||
|
Δ̂ |
10.068a (0.000) |
||||
|
Δ̂adj |
11.067a (0.000) |
||||
Note: Probability values are in parentheses. a and b denote 1% and and 5% levels of significance, respectively. Δ̂ denotes delta, Δ̂adj denotes adjusted delta.
Since CSD and slope heterogeneity are determined, the stationarity of the variables is examined with the CIPS test, which is the second generation unit root test. The results from the CIPS unit root tests are presented in Table 4. CIPS test estimates both the constant and the constant and trend. The CIPS unit root test revealed that all variables are stationary at the first difference. The test shows that all series are integrated at I(1).
Since the variables have been determined to have a long-run relationship, the impact of each independent indicator on poverty reduction should be evaluated. The Panel ARDL (MG and PMG) estimator is then used to investigate the effect of the specified explanatory variables on poverty reduction for the entire panel. The Hausman test statistic is presented in Table 6. The Hausman test statistic is equal to 5.82 with a p-value =0.757 and is insignificant. The Insignificant Hausman test accepted that PMG is a more efficient estimator than MG. Therefore, only the results of the PMG method are considered and interpreted.
Table 4. Results for CIPS unit root tests
|
Variables |
Level |
First difference |
||
|
constant |
constant |
constant |
constant and trend |
|
|
lnPOV |
-1.888 |
-2.136 |
-4.601a |
-4.655a |
|
lnGINI |
-3.602 |
-1.784 |
-3.650a |
-3.658a |
|
lnREC |
-1.865 |
-2.147 |
-4.981a |
-4.977a |
|
lnNREC |
-2.571 |
-1.918 |
-3.589a |
-3.748a |
|
lnGDP |
-2.038 |
-2.368 |
-4.673a |
-4.812a |
Note: At constant 1%, 5%, and 10% critical values for CIPS are -2.57, -2.33 and -2.21, respectively. At constant and trend 1%, 5%, and 10% critical values for CIPS are -3.1, -2.86 and -2.73, respectively. a is the 1% levels of significance.
After confirming the CSD, slope heterogeneity and stationarity properties of the series, the second generation panel cointegration test, as developed by Westerlund (2008) which is robust under the presence of CSD, is applied. Table 5 reveals the D-H result. The D-H test indicates that the alternative hypothesis of cointegration is strongly accepted. In that case, there exists a long-run relationship between income inequality, per capita renewable energy consumption, per capita non-renewable energy consumption, per capita GDP and poverty reduction.
Table 5. Result of the Durbin-Hausman cointegration test
|
Stattistic |
p-value |
|
|
Constant |
||
|
DHg |
16.080a |
0.000 |
|
DHp |
45.644a |
0.000 |
|
Constant and trend |
||
|
DHg |
3.122a |
0.001 |
|
DHp |
11.630a |
0.000 |
Note: a is the 1% levels of significance.
Table 6. Result of Pooled Mean Group and Mean Group estimation
|
Variables |
Coefficient |
Std. Error |
t-statistic |
p-value |
|
Long-run result (PMG) |
||||
|
lnGINI |
-0.130 |
0.033 |
-3.89 |
0.000a |
|
lnREC |
0.047 |
0.019 |
2.42 |
0.016b |
|
lnNREC |
-0.122 |
0.039 |
-3.14 |
0.002a |
|
lnGDP |
1.030 |
0.012 |
84.01 |
0.000a |
|
Long-run result (MG) |
||||
|
lnGINI |
-0.437 |
0.105 |
-4.15 |
0.000a |
|
lnREC |
-0.099 |
0.224 |
-0.44 |
0.658 |
|
lnNREC |
-0.453 |
0.301 |
-1.51 |
0.132 |
|
lnGDP |
1.116 |
0.074 |
14.98 |
0.000a |
|
Short-run result (PMG) |
||||
|
∆lnGINI |
-0.212 |
0.152 |
-1.39 |
0.164 |
|
∆lnREC |
-0.152 |
0.077 |
-1.96 |
0.050c |
|
∆lnNREC |
-0.316 |
0.145 |
-2.18 |
0.029b |
|
∆lnGDP |
0.586 |
0.113 |
5.18 |
0.000a |
|
C |
-0.639 |
0.187 |
-3.42 |
0.001a |
|
ECT(-1) |
-0.372 |
0.115 |
-3.22 |
0.001a |
|
Short-run result (MG) |
||||
|
∆lnGINI |
0.006 |
0.043 |
0.15 |
0.879 |
|
∆lnREC |
-0.214 |
0.145 |
-1.48 |
0.139 |
|
∆lnNREC |
-0.171 |
0.097 |
-1.75 |
0.080c |
|
∆lnGDP |
0.443 |
0.166 |
2.67 |
0.008a |
|
C |
-5.190 |
3.749 |
-1.38 |
0.166 |
|
ECT(-1) |
-0.513 |
0.156 |
-3.27 |
0.001a |
|
Hausman Test |
||||
|
H0=PMG |
5.82 (0.757) |
|||
|
H1=MG |
||||
Note: a, b and c denote 1%, 5%, and 10% levels of significance, respectively.
In this study, poverty reduction is used as a proxy for per capita consumption expenditure. As Sehrawat and Giri (2018) stated in their study, per capita consumption expenditure means poverty reduction. According to the results of the PMG estimator (Table 6), the income inequality and per capita non-renewable energy consumption are negatively and significantly related to the poverty reduction. The result indicates that an increase in income inequality by 1% is linked with a decrease of the per capita consumption expenditure by -0.130%. An increase in per capita non-renewable energy consumption by 1% is linked with a decrease of the per capita consumption expenditure by -0.122%. These findings imply that income inequality and per capita non-renewable energy consumption worsen poverty reduction. While the high growth performance in the BRICS countries led to significant decreases in poverty, the decrease in income inequality was not as prominent as the decrease in poverty. Therefore, the increase in income inequality increased poverty. These findings are parallel to the findings documented by Zaman et al. (2020) for 124 countries and by Omar and Inaba (2020) for 116 developing countries. Non-renewable energy consumption is an essential role for the BRICS countries. However, while the increase in non-renewable energy consumption is an important input for the industry, it increases poverty. The findings corroborate the results produced by Ogbeide-Osaretin (2021) for Nigeria.
On the other hand, the per capita renewable energy consumption and the per capita income are positively and significantly related to the poverty reduction. An increase in per capita renewable energy consumption by 1% is linked with an increase of the per capita consumption expenditure by 0.047%. An increase in per capita income by 1% is linked with an increase of the per capita consumption expenditure by 1.030%. These findings imply that per capita renewable energy consumption and per capita income help poverty reduction. This explains the role of renewable energy in reducing poverty. This also indicates that the BRICS countries are on the right path towards attaining poverty alleviation goals via the advancement of renewable energy technologies. These findings are consistent with the results documented in the studies by Thiam (2011) and Khobai (2021) for Senegal and South Africa, respectively. The BRICS countries could take a more active role in the fight against poverty by using the information and technologies necessary for growth through sustainable development. Similar findings were reported for the case of Mexico by Garza-Rodriguez (2018), for the case of Nigeria by Dada and Fanowopo (2020), and for the case of Pakistan by Chishti, Rehman and Murshed (2021). The error correction term is -0.372, and it is statistically significant. As Uzar (2020) stated, this result refers that it converges to balance in the long-run.
Conclusion and policy recommendations
The main purpose of this study was to examine the relationship between income inequality, per capita renewable energy consumption, per capita non-renewable energy consumption, per capita income and poverty in the BRICS countries. The annual data from 1991–2019 were applied for the analysis. Stationarity was checked among the variables by using the CIPS unit root test. Cointegration was examined among the variables by using the Durbin-Hausman cointegration test. The Panel ARDL (MG and PMG) method was used to reveal the variable linkages with the short-run and long-run analysis. Study outcomes during the long-run per capita income and per capita renewable energy consumption have positive interaction on the household consumption expenditure. This means that growth and renewable energy consumption reduce poverty. On the other hand, the variables income inequality and per capita non-renewable energy consumption demonstrated an adverse influence on household consumption expenditure. This means that income inequality and per capita non-renewable energy consumption increase poverty.
Depending upon the estimates, the BRICS countries should take the appropriate measures to reduce poverty. It is often believed that poverty is a rising global concern now and that future conventional strategies by all countries should concentrate on reducing poverty. The BRICS countries should increase their per capita income and renewable energy investments and consumption to reduce poverty. In addition, they can reduce poverty by reducing the share of non-renewable energy consumption in the total energy consumption and by ensuring an equal distribution of income among individuals. Also, the BRICS countries should focus their efforts on developing an appropriate energy strategy that highlights the necessity of a renewable energy-driven economy powered by energy-saving technologies.
Poverty is increasing despite the improvements in the BRICS countries as inequalities in health and education continue to be significant, deficiencies in social infrastructure are not remedied, the actual impact of economic growth on reducing poverty is insufficient, and subsidies to the energy sector crowd out spending in the social sector. Therefore, in order to achieve the poverty reduction target of the SDG in the BRICS countries, it is necessary to reduce the inflation rate and ensure price stability in the BRICS countries.
Giving more importance to policies for redistribution and structural transformation in the BRICS countries can play an active role in reducing the growing inequality. If poor people have limited access to energy, they will be more likely to remain poor. By energy being made cheaper, more poor people can benefit from energy. For this, the poor people’s access to energy should be provided in an adequate and reliable way and at competitive prices. Ensuring energy access must be done in a sustainable way. Access to non-renewable energy is easier than access to renewable energy. Therefore, access to renewable energy consumption should be increased to overcome poverty. By shifting the investments made in the non-renewable energy sector to the renewable energy sector, poverty can be reduced by creating new business areas and employment. On the other hand, by reducing the negative impact of non-renewable energy consumption on the environment, its negative impact on the poor can be alleviated. Policy incentives for renewable energy should be adopted in order to ensure access to renewable energy and increase its consumption. By providing appropriate and sufficient energy, the negative impact of energy on poverty can be reduced.
Our motivation is to examine the impact of income inequality, renewable energy consumption per capita, non-renewable energy consumption per capita, and per capita income on poverty. This study is limited to the fact that factors such as investments in the renewable energy sector, environmental performance and externalities arising from non-renewable energy consumption are not taken into account for any reason. For this reason, it is recommended to conduct a study that takes into account the effects of factors such as investments in the renewable energy sector, environmental performance and externalities arising from non-renewable energy consumption on poverty.
References
Adekoya, O.D. (2018). Impact of human capital development on poverty alleviation in Nigeria. International Journal of Economics & Management Sciences, 7(4), 1–8. http://dx.doi.org/10.4172/2162-6359.1000544
Adeleye, B.N., Gershon, O., Ogundipe, A., Owolabi, O., Ogunrinola, I., & Adediran, O. (2020). Comparative investigation of the growth-poverty-inequality trilemma in Sub-Saharan Africa and Latin American and Caribbean Countries. Heliyon, 6(12), e05631. https://doi.org/10.1016/j.heliyon.2020.e05631
Aghaei, M., & Lin Lawell, C.Y.C. (2020). Energy, economic growth, inequality, and poverty in Iran. The Singapore Economic Review, 1–22. http://clinlawell.dyson.cornell.edu/Iran_energy_growth_poverty_inequality_paper.pdf
Aghaei, M., & Rezagholizadeh, M. (2016). Some experimental evidences of the relationship between poverty and energy consumption in Iran. Journal of Macroeconomics, 11(22), 133–158.
Aigbokhan, B.E. (2000). Poverty, growth and ınequality in nigeria: a case study. African Economic Research Consortium Research Report. https://opendocs.ids.ac.uk/opendocs/bitstream/handle/20.500.12413/2262/rp102.pdf?sequence=1
Alam, A. (2020). Revisiting the relationship among growth, poverty and inequality to comprehend SDGs pathways: evidence from panel data of 23 countries. Alam, M.A., Alam, F. & Begum, D. (Eds.), Knowledge Management, Governance and Sustainable Development: Lessons and Insights from Developing Country, Routledge, India, pp.199–212, Available at SSRN: https://ssrn.com/abstract=3809665
Alesina, A., & Rodrik, D. (1994). Distributive politics and economic growth. The Quarterly Journal of Economics, 109(2), 465–490. https://doi.org/10.2307/2118470
Amin, S., Jamasb, T., & Nepal, R. (2021). Regulatory reform and the relative efficacy of government versus private investment on energy consumption in South Asia. Economic Analysis and Policy, 69, 421–433. https://doi.org/10.1016/j.eap.2020.12.019
Anikin, V., & Tikhonova, N. (2016). Poverty and inequality in BRICS Countries: The Case of Russia. Sociological Research, 55(5), 305–341. https://doi.org/10.1080/10610154.2016.1294432
Anser, M.K., Yousaf, Z., Nassani, A.A., Alotaibi, S.M., Kabbani, A., & Zaman, K. (2020). Dynamic linkages between poverty, inequality, crime, and social expenditures in a panel of 16 countries: two-step GMM estimates. Journal of Economic Structures, 9, 1–25.
Attiaoui, I., & Boufateh, T. (2019). Impacts of climate change on cereal farming in Tunisia: a panel ARDL–PMG approach. Environmental Science and Pollution Research, 26(13), 13334–13345.
Aziz, Y., Mansor, F., Waqar, S., & Haji Abdullah, L. (2020). The nexus between zakat and poverty reduction, is the effective utilization of zakat necessary for achieving SDGs: A multidimensional poverty index approach. Asian Social Work and Policy Review, 14(3), 235–247. https://doi.org/10.1111/aswp.12212
Baloch, M.A., Khan, S.U.D., Ulucak, Z.Ş., & Ahmad, A. (2020). Analyzing the relationship between poverty, income inequality, and CO2 emission in Sub-Saharan African countries. Science of The Total Environment, 740, 139867. https://doi.org/10.1016/j.scitotenv.2020.139867
Barnes, D.F., Khandker, S.R., & Samad, H.A. (2010). Energy access, efficiency, and poverty: how many households are energy poor in Bangladesh? World Bank Policy Research Working Paper, (5332).
Barro, R.J. (2000). Inequality and growth in a panel of countries. Journal of Economic Growth, 5(1), 5–32.
Bergstrom, K. (2020). The role of inequality for poverty reduction. Policy Research Working Paper; No. 9409. World Bank, Washington, DC.
Breusch, T.S., & Pagan, A.R. (1980). The Lagrange multiplier test and its applications to model specification in econometrics. The Review of Economic Studies, 47(1), 239–253.
British Petrol (2021). Statistical Review of World Energy 2021. https://www.bp.com/en/global/corporate/energy-economics/statistical-review-of-world-energy.html
Cabraal, R.A., Barnes, D.F., & Agarwal, S.G. (2005). Productive uses of energy for rural development. Annual Review of Environment and Resources, 30, 117–144.
Cerra, V., Lama, R., & Loayza, N.V. (2021). Links between growth, inequality, and poverty. International Monetary Fund, 68, 1–54, https://doi.org/10.5089/9781513572666.001
Cheema, A.R., & Sial, M.H. (2012). Poverty, income inequality, and growth in Pakistan: A pooled regression analysis. The Lahore Journal of Economics, 17(2), 137–157.
Chirambo, D. (2018). Towards the achievement of SDG 7 in sub-Saharan Africa: Creating synergies between power Africa, sustainable energy for all and climate finance in-order to achieve universal energy access before 2030. Renewable and Sustainable Energy Reviews, 94, 600–608.
Chishti, M.Z., Rehman, A., & Murshed, M. (2021). An estimation of the macroeconomic determinants of income poverty in Pakistan? Evidence from a non‐linear ARDL approach. Journal of Public Affairs, e2719.
Dada, J.T., & Fanowopo, O. (2020). Economic growth and poverty reduction in Nigeria: The role of institutions. Ilorin Journal of Economic Policy, 7(7), 1–15.
Danish […], Wang, Z. (2019). Does biomass energy consumption help to control environmental pollution? Evidence from BRICS countries. Science of the total environment, 670, 1075–1083. https://doi.org/10.1016/j.scitotenv.2019.03.268
Datt, G., & Ravallion, M. (1992). Growth and redistribution components of changes in poverty measures: A decomposition with applications to Brazil and India in the 1980s. Journal of Development Economics, 38(2), 275–295. https://doi.org/10.1016/0304-3878(92)90001-P
Deininger, K., & Squire, L. (1996). A new data set measuring income inequality. The World Bank Economic Review, 10(3), 565–591. https://doi.org/10.1093/wber/10.3.565
Destek, M.A., Ulucak, R., & Dogan, E. (2018). Analyzing the environmental Kuznets curve for the EU countries: the role of ecological footprint. Environmental Science and Pollution Research, 25(29), 29387–29396.
Diaz-Chavez, R., Johnson, F.X., Richard, T.L., & Chanakya, H. (2015). Biomass resources, energy access and poverty reduction. Souza, G.M., Victoria, R., Joly, C., Verdade, L. (Eds.), Bioenergy and Sustainability: Bridging the Gaps. Scientific Committee on Problems of the Environment (SCOPE), Paris.
Dollar, D., & Kraay, A. (2002). Growth is good for the poor. Journal of Economic Growth, 7(3), 195–225.
Dollar, D., Kleineberg, T., & Kraay, A. (2016). Growth still is good for the poor. European Economic Review, 81, 68–85. https://doi.org/10.1016/j.euroecorev.2015.05.008
Erdogan, S., Okumus, I., & Guzel, A.E. (2020). Revisiting the Environmental Kuznets Curve hypothesis in OECD countries: the role of renewable, non-renewable energy, and oil prices. Environmental Science and Pollution Research, 27(19), 23655–23663.
Feriyanto, N., El Aiyubbi, D., & Nurdany, A. (2020). The impact of unemployment, minimum wage, and real gross regional domestic product on poverty reduction in provinces of Indonesia. Asian Economic and Financial Review, 10(10), 1088–1099.
Forbes, K. J. (2000). A reassessment of the relationship between inequality and growth. American Economic Review, 90(4), 869–887.
Foster, V., & Tré, JP (2003). Measuring the Impact of Energy Interventions on the Poor—An Illustration from Guatemala. PJ Brook and TC Irwin, eds., Infrastructure for Poor People, 125–78.
Foster, V., Tre, JP, & Wodon, Q. (2000). Energy prices, energy efficiency, and fuel poverty. Latin America and Caribbean Regional Studies Program. Washington, DC: World Bank.
Garidzirai, R., & Matiza, T. (2020). Exploring the tourism-poverty alleviation nexus in the BRICS group of nations. Ekonomika, 99(1), 93–109. https://doi.org/10.15388/Ekon.2020.1.6
Garza-Rodriguez, J. (2018). Poverty and economic growth in Mexico. Social Sciences, 7(10), 183. https://doi.org/10.3390/socsci7100183
Hailemariam, A., & Dzhumashev, R. (2020). Income inequality and economic growth: heterogeneity and nonlinearity. Studies in Nonlinear Dynamics & Econometrics, 24(3), 1–15. https://doi.org/10.1515/snde-2018-0084
Hassan, S.A., Zaman, K., & Gul, S. (2015). The relationship between growth-inequality-poverty triangle and environmental degradation: unveiling the reality. Arab Economic and Business Journal, 10(1), 57–71. https://doi.org/10.1016/j.aebj.2014.05.007
Hichem, A. (2016). Poverty, inequality and economic growth in Algeria: An ARDL approach. Journal of Social and Economic Statistics, 5(1), 1–20.
Hosier, R.H., & Dowd, J. (1987). Household fuel choice in Zimbabwe: an empirical test of the energy ladder hypothesis. Resources and Energy, 9(4), 347–361.
Hussein, M.A., & Leal Filho, W. (2012). Analysis of energy as a precondition for improvement of living conditions and poverty reduction in sub-Saharan Africa. Scientific Research and Essays, 7(30), 2656–2666. https://doi.org/10.5897/SRE11.929
ILO (2020). Poverty alleviation through social and economic transformation. https://www.ilo.org/global/about-the-ilo/how-the-ilo-works/multilateral-system/brics/2020/WCMS_771116/lang--en/index.htm
Imimole, B. (2021). Population growth, economic growth, inequality and poverty reduction in Nigeria. SAU Journal of Management and Social Sciences, 6(1), 1–12.
Inglesi-Lotz, R. (2016). The impact of renewable energy consumption to economic growth: A panel data application. Energy Economics, 53, 58–63. https://doi.org/10.1016/j.eneco.2015.01.003
Ito, K. (2017). CO2 emissions, renewable and non-renewable energy consumption, and economic growth: Evidence from panel data for developing countries. International Economics, 151, 1–6.
Jairaj, B., Deka, P., Martin, S., & Kumar, S. (2017). Can Renewable Energy Jobs Help Reduce Poverty in India? World Resources Intitute.
Kaygusuz, K. (2011). Energy services and energy poverty for sustainable rural development. Renewable and Sustainable Energy Reviews, 15(2), 936–947. https://doi.org/10.1016/j.rser.2010.11.003
Khandker, S.R., Barnes, D.F., & Samad, H.A. (2012). Are the energy poor also income poor? Evidence from India. Energy Policy, 47, 1–12. https://doi.org/10.1016/j.enpol.2012.02.028
Khobai, H. (2021). Renewable energy consumption, poverty alleviation and economic growth nexus in South Africa: ARDL bounds test approach. International Journal of Energy Economics and Policy, 11(5), 450–459. https://doi.org/10.32479/ijeep.7215
Koçak, E., & Şarkgüneşi, A. (2017). The renewable energy and economic growth nexus in Black Sea and Balkan countries. Energy Policy, 100, 51–57.
Kousar, S., & Shabbir, A. (2021). Analysis of environmental degradation mechanism in the nexus among energy consumption and poverty in Pakistan. Environmental Science and Pollution Research, 28(22), 27528–27541.
Lau, L.S., Choong, C.K., Ng, C.F., Liew, F.M., & Ching, S.L. (2019). Is nuclear energy clean? Revisit of Environmental Kuznets Curve hypothesis in OECD countries. Economic Modelling, 77, 12–20. https://doi.org/10.1016/j.econmod.2018.09.015
Leach, G. (1992). The energy transition. Energy Policy, 20(2), 116–123. https://doi.org/10.1016/0301-4215(92)90105-B
Leow, K.W., & Tan, E.C. (2019). Determinants of poverty: A dynamic panel data analysis with controls for income level and inequality. Malaysian Journal of Economic Studies, 56(2), 227–242.
Li, Z.Z., Li, R.Y.M., Malik, M.Y., Murshed, M., Khan, Z., & Umar, M. (2021). Determinants of carbon emission in China: how good is green investment? Sustainable Production and Consumption, 27, 392–401. https://doi.org/10.1016/j.spc.2020.11.008
Magombeyi, M.T., & Odhiambo, N.M. (2018). Dynamic impact of FDI inflows on poverty reduction: Empirical evidence from South Africa. Sustainable Cities and Society, 39, 519–526.
Mahmood, N., Wang, Z., & Hassan, S. T. (2019). Renewable energy, economic growth, human capital, and CO 2 emission: an empirical analysis. Environmental Science and Pollution Research, 26(20), 20619–20630. https://doi.org/10.1007/s11356-019-05387-5
Marrero, G.A., & Servén, L. (2018). Growth, inequality, and poverty: A robust relationship? World Bank Policy Research Working Paper, (8578).
Mboumboue, E., & Njomo, D. (2016). Potential contribution of renewables to the improvement of living conditions of poor rural households in developing countries: Cameroon׳ s case study. Renewable and Sustainable Energy Reviews, 61, 266–279. https://doi.org/10.1016/j.rser.2016.04.003
Michálek, A., & Výbošťok, J. (2019). Economic growth, inequality and poverty in the EU. Social Indicators Research, 141(2), 611–630.
Mulok, D., Kogid, M., Asid, R., & Lily, J. (2012). Is economic growth sufficient for poverty alleviation? Empirical evidence from Malaysia. Cuadernos de economía, 35(97), 26–32. https://doi.org/10.1016/S0210-0266(12)70020-1
Murshed, M., Haseeb, M., & Alam, M.S. (2021). The Environmental Kuznets Curve hypothesis for carbon and ecological footprints in South Asia: The role of renewable energy. GeoJournal, 1–28.
Nansadiqa, L., Masbar, R., & Majid, M.S.A. (2019). Does economic growth matter for poverty reduction in Indonesia. East African Scholars Journal of Economics, Business and Management, 2(2), 46–52.
Narayan, S., & Doytch, N. (2017). An investigation of renewable and non-renewable energy consumption and economic growth nexus using industrial and residential energy consumption. Energy Economics, 68, 160–176.
Ngepah, N. (2011). Exploring the impact of energy sources on production, inequality and poverty in simultaneous equations models for South Africa. African Development Review, 23(3), 335–351.
Norton, S.W. (2002). Economic growth and poverty: In search of trickle-down. Cato J., 22, 263.
Nuruddeen, T., & Ibrahim, S.S. (2014). An empirical study on the relationship between poverty, inequality and economic growth in Nigeria. Journal of Economics and Sustainable Development, 5(26), 20–24.
Nwani, S.E., & Osuji, E. (2020). Poverty in Sub-Saharan Africa: The dynamics of population, energy consumption and misery index. International Journal of Management, Economics and Social Sciences (IJMESS), 9(4), 247–270. http://dx.doi.org/10.32327/IJMESS/9.4.2020.13
Nyasha, S., Gwenhure, Y., & Odhiambo, N. M. (2017). Poverty and economic growth in Ethiopia: A multivariate causal linkage. The Journal of Developing Areas, 51(1), 343–359.
Odhiambo, N.M. (2009). Finance-growth-poverty nexus in South Africa: A dynamic causality linkage. The Journal of Socio-Economics, 38(2), 320–325.
Ogbeide-Osaretin, E.N. (2021). Analysing energy consumption and poverty reduction nexus in Nigeria. International Journal of Sustainable Energy, 40(5), 477–493. https://doi.org/10.1080/14786451.2020.1815744
Okwanya, I., & Abah, P.O. (2018). Impact of energy consumption on poverty reduction in Africa. CBN Journal of Applied Statistics (JAS), 9(1), 105–139.
Okwanya, I., Moses, O., Alhassan, A. (2015). Economic linkages between energy consumption and poverty reduction: Implication on sustainable development in Nigeria. International Journal of Innovative Social Sciences and Humanities Research, 3(2), 113–120.
Omar, M.A., & Inaba, K. (2020). Does financial inclusion reduce poverty and income inequality in developing countries? A panel data analysis. Journal of Economic Structures, 9(1), 1–25.
Osinubi, T.T., & Olomola, P.A. (2020). Globalisation, income inequality and poverty relationships: evidence from Mexico, Indonesia, Nigeria and Turkey. Journal of Economic and Administrative Sciences, 37(2), 179–208. https://doi.org/10.1108/JEAS-01-2020-0006
Pereira, M.G., Freitas, M.A.V., & da Silva, N.F. (2010). Rural electrification and energy poverty: Empirical evidences from Brazil. Renewable and Sustainable Energy Reviews, 14(4), 1229–1240. https://doi.org/10.1016/j.rser.2009.12.013
Pesaran M.H (2004) General diagnostic tests for cross-section dependence in panels. Camb Work Pap in Econ (CWPE).
Pesaran, M.H. (2007). A simple panel unit root test in the presence of cross‐section dependence. Journal of Applied Econometrics, 22(2), 265–312.
Pesaran, M.H., & Smith, R. (1995). Estimating long-run relationships from dynamic heterogeneous panels. Journal of Econometrics, 68(1), 79–113.
Pesaran, M.H., & Yamagata, T. (2008). Testing slope homogeneity in large panels. Journal of Econometrics, 142(1), 50–93.
Pesaran, M.H., Shin, Y., & Smith, R.P. (1999). Pooled mean group estimation of dynamic heterogeneous panels. Journal of the American Statistical Association, 94(446), 621–634.
Pesaran, M.H., Ullah, A., & Yamagata, T. (2008). A bias‐adjusted LM test of error cross‐section independence. The Econometrics Journal, 11(1), 105–127. https://doi.org/10.1111/j.1368-423X.2007.00227.x
Qamruzzaman, M., & Jianguo, W. (2020). The asymmetric relationship between financial development, trade openness, foreign capital flows, and renewable energy consumption: Fresh evidence from panel NARDL investigation. Renewable Energy, 159, 827–842. https://doi.org/10.1016/j.renene.2020.06.069
Quartey, P. (2008). Financial Sector Development, Savings Mobilization and Poverty Reduction in Ghana. In Guha-Khasnobis B., Mavrotas G. (Eds.), Financial Development, Institutions, Growth and Poverty Reduction. Studies in Development Economics and Policy. Palgrave Macmillan, London. https://doi.org/10.1057/9780230594029_5
Rafindadi, A.A., & Ozturk, I. (2017). Impacts of renewable energy consumption on the German economic growth: Evidence from combined cointegration test. Renewable and Sustainable Energy Reviews, 75, 1130–1141. https://doi.org/10.1016/j.rser.2016.11.093
Ravallion, M. (1992). Poverty comparisons: A guide to concepts and methods. The World Bank. https://agris.fao.org/agris-search/search.do?recordID=US2012417541
Saha, A. K., & Mishra, V. (2020). Genetic distance, economic growth and top income shares: evidence from OECD countries. Economic Modelling, 92, 37–47. https://doi.org/10.1016/j.econmod.2020.07.007
Sakanko, M.A., & David, J. (2018). The relationship between poverty and energy use in Niger State. Journal of Economics and Development, 1(3), 139–154.
Sasmal, R., & Sasmal, J. (2016). Public expenditure, economic growth and poverty alleviation. International Journal of Social Economics, 43(6), 604–618.
Sehrawat, M., & Giri, A.K. (2016). Financial development and poverty reduction in India: an empirical investigation. International Journal of Social Economics, 43(2),106–122. https://doi.org/10.1108/IJSE-01-2014-0019
Sehrawat, M., & Giri, A.K. (2018). The impact of financial development, economic growth, income inequality on poverty: evidence from India. Empirical Economics, 55(4), 1585–1602. https://doi.org/10.1007/s00181-017-1321-7
Shafique, M., Azam, A., Rafiq, M., & Luo, X. (2021). Investigating the nexus among transport, economic growth and environmental degradation: Evidence from panel ARDL approach. Transport Policy, 109, 61–71. https://dx.doi.org/10.1007%2Fs11356-019-04455-0
Solarin, S.A. (2021). Modelling two dimensions of poverty in selected developing countries: the impact of fossil fuel subsidies. Social Indicators Research, 160(1), 357–379.
Soylu, Ö.B. (2015). The poverty, growth and inequality in Canada. International Journal of Current Research, 10(10), 74326–74332.
Stephen, B.A., & Simoen, I.A. (2013). Does economic growth reduce poverty in Nigeria. Developing Country Studies, 3(9), 62–68.
Sulaiman, C., & Abdul-Rahim, A.S. (2020). The impact of wood fuel energy on economic growth in sub-Saharan Africa: dynamic macro-panel approach. Sustainability, 12(8), 3280. https://doi.org/10.3390/su12083280
Tarazkar, M.H., Dehbidi, N.K., Ozturk, I., & Al-Mulali, U. (2020). The impact of age structure on carbon emission in the Middle East: the panel autoregressive distributed lag approach. Environmental Science and Pollution Research, 28, 33722–33734. https://doi.org/10.1007/s11356-020-08880-4
Thiam, D.R. (2011). Renewable energy, poverty alleviation and developing nations: Evidence from Senegal. Journal of Energy in Southern Africa, 22(3), 23–34. https://doi.org/10.17159/2413-3051/2011/v22i3a3219
Todaro, M. P. (1997). Economic Development. Reading, Mass.: AddisonWesley.
Tridico, P. (2010). Growth, inequality and poverty in emerging and transition economies. Transition Studies Review, 16(4), 979–1001. https://doi.org/10.1007/s11300-009-0116-8
Tsaurai, K. (2018). Investigating the impact of foreign direct investment on poverty reduction efforts in Africa. Revista Galega de Economía, 27(2), 139–154. https://doi.org/10.15304/rge.27.2.5664
Tsaurai, K. (2021). Energy Consumption-poverty Reduction nexus in BRICS Nations. International Journal of Energy Economics and Policy, 11(3), 555–562. https://doi.org/10.32479/ijeep.11075
Ulucak, R., Khan, S.U.D., Baloch, M.A., & Li, N. (2020). Mitigation pathways toward sustainable development: Is there any trade‐off between environmental regulation and carbon emissions reduction? Sustainable Development, 28(4), 813–822. https://doi.org/10.1002/sd.2032
UNDP (2005). Energizing the MDGs: a guide to energy’s role in reducing poverty. New York, NY, 2005.
United Nations (2021b). Ending Poverty. https://www.un.org/en/global-issues/ending-poverty
United Nations. (2021a). The 17 Goals. https://sdgs.un.org/goals
Uzar, U. (2020). Political economy of renewable energy: Does institutional quality make a difference in renewable energy consumption? Renewable Energy, 155, 591–603. https://doi.org/10.1016/j.renene.2020.03.172
Vyas-Doorgapersad, S. (2021). Global governance reforms to achieve Sustainable Development Goal One (no poverty) in BRICS. Africa’s Public Service Delivery & Performance Review, 9(1), 9. https://doi.org/10.4102/apsdpr.v9i1.545
Westerlund, J. (2008). Panel cointegration tests of the Fisher effect. Journal of Applied Econometrics, 23(2), 193–233. https://doi.org/10.1002/jae.967
World Bank (2021). Poverty, https://www.worldbank.org/en/topic/poverty/overview#1 (Accessed date: 30.09.2021)
World Bank (2021). World Development Indicator, https://databank.worldbank.org/source/world-development-indicators.
World Inequality Database (2021). https://wid.world/data/
Wu, R., & Xie, Z. (2020). Identifying the impacts of income inequality on CO2 emissions: empirical evidences from OECD countries and non-OECD countries. Journal of Cleaner Production, 277, 123858. https://doi.org/10.1016/j.jclepro.2020.123858
Zaman, K., Al-Ghazali, B.M., Khan, A., Rosman, A.S.B., Sriyanto, S., Hishan, S.S., & Bakar, Z.A. (2020). Pooled mean group estimation for growth, inequality, and poverty triangle: evidence from 124 countries. Journal of Poverty, 24(3), 222–240. https://doi.org/10.1080/10875549.2019.1678553
Zaman, K., Rashid, K., Khan, M.M., & Ahmad, M. (2011). Panel data analysis of growth, inequality and poverty: evidence from SAARC countries. Journal of Yasar University, 21(6), 3523–3537.
Zeb, R., Salar, L., Awan, U., Zaman, K., & Shahbaz, M. (2014). Causal links between renewable energy, environmental degradation and economic growth in selected SAARC countries: progress towards green economy. Renewable Energy, 71, 123–132. https://doi.org/10.1016/j.renene.2014.05.012
Geall, S., & Shen, W. (2018). Solar energy for poverty alleviation in China: state ambitions, bureaucratic interests, and local realities. Energy research & social science, 41, 238–248. https://doi.org/10.1016/j.erss.2018.04.035
Liao, C., & Fei, D. (2019). Poverty reduction through photovoltaic-based development intervention in China: potentials and constraints. World Development, 122, 1–10. https://doi.org/10.1016/j.worlddev.2019.04.017
Zhang, H., Wu, K., Qiu, Y., Chan, G., Wang, S., Zhou, D., & Ren, X. (2020). Solar photovoltaic interventions have reduced rural poverty in China. Nature communications, 11(1), 1–10.
Li, J., Wang, Z., Cheng, X., Shuai, J., Shuai, C., & Liu, J. (2020). Has solar PV achieved the national poverty alleviation goals? Empirical evidence from the performances of 52 villages in rural China. Energy, 201, 117631. https://doi.org/10.1016/j.energy.2020.117631
Liu, J., Huang, F., Wang, Z., & Shuai, C. (2021). What is the anti-poverty effect of solar PV poverty alleviation projects? Evidence from rural China. Energy, 218, 119498. https://doi.org/10.1016/j.energy.2020.119498